Indicators of economic and financial conditions in the Tenth District’s low- and moderate-income (LMI) community were mixed in the second half of 2014. The LMI Financial Condition Index, a broad measure of economic and financial conditions, was flat and remained significantly below neutral, indicating an overall assessment of deterioration by survey respondents. Expectations were near neutral going forward, however. In the past, expectations for the financial conditions index have been a somewhat accurate indicator of the next survey’s current reading, although expectations typically overestimate the value. The demand for the services of organizations responding to the survey remained well below neutral. Contacts reported that extensive long-term unemployment, low wages and reduced public assistance are among factors that have sustained increasing demand for services nearly six years into the economic recovery. Of the many organizations helping clients sign up for health insurance under the Affordable Care Act (ACA), a significant share reported problems in doing so through their responses to a special question in the survey.
The LMI Job Availability Index fell toward neutral after having been strongly in positive territory since the first quarter of 2012. A significant majority of survey respondents reported no changes in the LMI labor market. Respondents continued to cite low and stagnant wages, inadequate education and training and practical difficulties like transportation and childcare as limiting the well-being of LMI workers. Contacts are increasingly reporting reductions in work hours, ostensibly to disqualify workers for fringe benefits, especially under the ACA. The Credit Access Index closed in on neutral, while the Affordable Housing Index fell further from neutral in the fourth quarter of 2014. Both the Organization Funding and Capacity Indexes saw significant improvement.
Details
The LMI Financial Condition Index was flat in the second half of 2014, declining slightly from 72.8 to 70.0.1 The index, which provides the broadest assessment of economic conditions in the LMI community, remained significantly below its high of 85.7 in early 2013. A value of 70.0—well below a neutral reading of 100—indicates moderate deterioration in general economic conditions in the LMI community.2 Still, about 62 percent of survey respondents gave neutral assessments of LMI economic conditions. Most indicators remained below neutral, but the job availability index, which is arguably the most significant determinant of overall economic conditions, was just above neutral. Overall, factors keeping the broad financial condition index below neutral are continued long-term unemployment, with associated declines in personal financial resources; wages that are insufficient to cover necessities; perceived increases in the cost of necessities; difficulties in securing affordable housing; and declines in the availability of public resources.
Another broad measure of economic conditions in the LMI community is the LMI Service Needs Index. The index reflects the demand for services provided by organizations responding to the survey. Inching down from 53.7 in the first half of 2014 to 50.8, the index has remained well below neutral since the survey was initiated in the first quarter of 2009.3 The index has shown just slight improvement since the recession officially ended, rising from 31.2 to 50.8.
The LMI Job Availability Index fell toward neutral after having been strongly in positive territory since the first quarter of 2012. A significant majority of survey respondents reported no changes in the LMI labor market. Respondents continued to cite low and stagnant wages, inadequate education and training and practical difficulties like transportation and childcare as limiting the well-being of LMI workers. Contacts are increasingly reporting reductions in work hours, ostensibly to disqualify workers for fringe benefits, especially under the ACA. The Credit Access Index closed in on neutral, while the Affordable Housing Index fell further from neutral in the fourth quarter of 2014. Both the Organization Funding and Capacity Indexes saw significant improvement.
Survey respondents continued to stress that the long-term unemployed have exhausted their resources, including unemployment compensation. Respondents cited this exhaustion as the most critical contributor to continued increases in the demand for services. Further, employment growth in sectors relevant to generally lower-skilled LMI workers significantly lagged job gains in higher-skilled sectors. The prices of necessities also were reported to have boosted the demand for services. Some contacts blamed flatter or declining wages following the recession, when many of the jobs that were lost were replaced by lower paying jobs. Contacts suggested a decline in services offered by federal and local governments has led many of the LMI to seek the support of organizations providing social services. A surprise in the current survey compared to previous reports is that some contacts reported that too many of the LMI are relying on public assistance. Poor financial decisions were cited as a contributing factor in the growth in demand for services. Finally, at a more benign level, many contacts noted increased awareness of their services, in part due to increased marketing efforts.
A significant number of survey respondents cited healthcare as a primary concern of their clients. Many of their LMI constituents were said to lack access to affordable healthcare. The effect of the Affordable Care Act (ACA) on this problem remains to be seen, as the program is not fully implemented. But ACA efforts already under way suggest that securing healthcare for LMI families and individuals may continue to be a challenge.
A special survey question asked respondents about progress made by their constituents in signing up for health insurance under the ACA and problems that may have surfaced. Contacts reported they feel many clients who do not qualify for Medicaid do not have sufficient income to afford health coverage under the ACA, even with subsidies. This problem has been exacerbated, according to some respondents, by the decisions of five of the seven Tenth District states to decline matching funds for Medicaid expansion under the ACA.4 Another problem raised by contacts is a lack of information among LMI people about the process for selecting an appropriate plan, especially in states that do not participate in insurance exchanges; the costs that are involved in securing and maintaining a health insurance plan; and eligibility criteria. Organizations that have hosted “sign-up sessions” and information sessions have reported success in their efforts, although many have been flooded with requests. Successful interventions often have required individual assistance.
The LMI Job Availability Index fell to 102.5 from 115.4. The decline is significant in that the index moved sharply back toward neutral, suggesting the general assessment of survey respondents is that the market for jobs relevant to most LMI workers has stagnated. Nevertheless, additional data on LMI job availability would be required to establish a new trend. Other indicators, while mixed, were mostly flat, giving little support to addressing the decline in the Job Availability Index.
Although LMI communities have gained jobs, survey respondents report most of these jobs pay wages that are low and stagnant, especially relative to the cost of living. Many respondents advocated for establishing a “living wage,” a common refrain in LMI Survey responses in recent years. Contacts noted work hours have been cut for some LMI workers, ostensibly to avoid paying fringe benefits, including those mandated by the ACA. On a structural level, contacts reported there is an ongoing need for employment readiness, education, training and job placement among LMI workers. Respondents said common barriers to work included increasingly expensive childcare, unreliable transportation, skill and readiness issues, income-based reductions in public assistance and criminal histories. Increased creation of small businesses was cited as a good way to create jobs for LMI workers, especially in rural areas.
The LMI Affordable Housing Index fell to 70.0 from 78.7. As with other survey indexes, the affordable housing index reflects changes in conditions, and thus, does not address whether the current stock of housing is sufficient to meet current needs. In their comments, most survey respondents reported that the current stock of affordable housing is inadequate. Nevertheless, only a minority reported that the adequacy of that stock is diminishing. The capacity of existing affordable housing to meet community needs varies widely across the Tenth District. Several survey respondents reported that affordable housing is becoming more available in their communities. Moreover, about 62 percent of survey respondents reported the state of affordable housing is stable (but not necessarily adequate).5 An index value below neutral suggests respondents overall see a diminishing ability of the existing stock of affordable housing to meet current needs.
A common theme among survey respondents was concern about a strikingly insufficient stock of affordable housing in rural areas. This is true especially where workers have traveled from other states to work at large enterprises, mostly meat-packing plants. Housing regulations and codes enforcement—such as lead abatement—were reported to have a disproportionate effect on LMI households because increased costs are likely to be passed on through higher rents. Reduced public spending has limited the ability of some organizations to construct or rehabilitate housing. Survey respondents continued a trend in recent years, reporting that the combination of increasing demand for rental housing and decreasing supply has led to increasing rents. These increases have priced some LMI individuals and families out of market-rate housing. This pattern, in turn, can put increased pressure on assisted housing. Other factors identified as having kept prospective LMI tenants out of housing include rental standards imposed by landlords (such as restrictions for criminal history, credit history, rental history and income), including for subsidized and otherwise affordable housing developments.
The LMI Credit Access Index increased significantly over the last six months, from 76.5 to 89.3, moving it near neutral. Indeed, about three-fourths of survey respondents reported no change in the accessibility of credit to LMI consumers. During the economic recovery that began in 2009, this index had consistently lagged most other indexes generated from survey responses. Although fewer than 20 percent of respondents reported more restrictive credit, in aggregate they still indicated credit is too restrictive.
Some organizations that work in the affordable housing sector reported some credit restrictions for their projects, especially in terms of loan-to-value and debt coverage ratios.6 Few mentions were made of mortgage-related credit, except for concerns about the availability of mortgage credit to those who are unemployed and have related damage to their credit standing. The credit situation facing many of the formerly long-term unemployed was also reported to be affecting other aspects of their financial lives. Over the last several surveys, respondents increasingly have commented about student loan issues.7 Many are concerned generally about the debt burden of student loans and the limitation that burden puts on other spending, including housing. A more specific concern is student loan debt acquired while attending for-profit colleges, many of which are Internet-based. Respondents are concerned that most of these students are unable to get a good-paying job that would allow them to repay that debt. A relatively new concern that appeared in survey responses was auto loan debt. Specifically, many LMI consumers, especially those who have been out of work for some time, must finance their vehicles with high-dollar, subprime auto loans. As is typical in these surveys, contacts emphasized the importance of financial literacy in restoring the credit of many LMI consumers.
The LMI Organization Capacity Index, which measures the adequacy of nonfinancial resources such as staff quality and volunteers, surged to 111.7 from 93.4. This significant increase suggests that while funding may be a problem for many organizations, the capacity of Tenth District community development and social services organizations overall to provide services has been maintained, and has even expanded for some.
The LMI Organization Funding Index increased significantly in the last half of 2014, from 83.1 to 96.6, or almost neutral. Although the index was near neutral, survey comments largely decried a lack of funding. Thus, the general assessment is that funding is inadequate compared to needs in the LMI community, but that a large majority of community development and social services organizations is not facing a deteriorating financial situation. Many contacts reported significant cuts in their public resources in previous periods and noted that these cuts had limited their abilities to maintain existing programs or to expand their efforts. Expectations for early 2015 were neutral.
Diffusion Indexes for Low-and Moderate-Income Indicators*
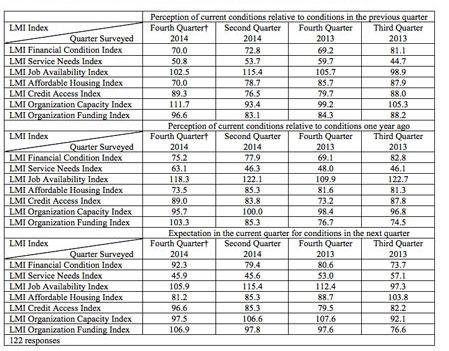
*Providers of services for the low- and moderate-income population responded to each item by indicating whether conditions during the current quarter were “higher” (or “better”) than, “lower” (or “worse”) than, or the same as in the previous quarter or year. Index numbers are computed by subtracting the percent of service providers that responded “lower” (or “worse”) from the percent of service providers that responded “higher” (or “better”) and adding 100. The exception is the LMI Service Needs Index, which is computed by subtracting the percent of service providers that responded “higher” (or “better”) from the percent of service providers that responded “lower” (or “worse”) and adding 100 to show that higher needs translate into lower numbers for the index.
A value of 100 is neutral in the indexes. Any number below 100 indicates the overall assessment of survey respondents is that conditions are worsening. For example, an increase in the index from 70 to 85 would indicate conditions are still deteriorating, by consensus, but that fewer respondents are reporting worsening conditions. Any value above 100 indicates improving conditions, even if the index has fallen from the previous quarter.
The views expressed are those of the authors and do not necessarily reflect the positions of the Federal Reserve Bank of Kansas City or the Federal Reserve System.