The LMI Labor Force Report provides a snapshot of low- and moderate-income (LMI) labor market conditions in the Federal Reserve’s Tenth District. LMI individuals (or families) have incomes of less than 80 percent of area median income, which is defined as metropolitan median income for urban residents and state median income for rural residents. The February 2015 report contains updated information from the Kansas City Fed’s LMI Survey (latest edition is fourth quarter of 2014) on the availability of jobs in LMI communities and obstacles faced by LMI workers._ In addition, individual-level data from the Current Population Survey (CPS) are used to compute statistics about the LMI labor market._
Job Availability in Tenth District LMI Communities
The Federal Reserve Bank of Kansas City conducts a semiannual survey (quarterly prior to second quarter of 2014) of organizations that work directly with the LMI population. One set of questions asks about the availability of jobs for LMI workers. Survey responses are used to create diffusion indexes that range from zero (most deterioration in conditions) to 200 (most improvement in conditions), where 100 is neutral. A diffusion index has a rolling benchmark, meaning it registers changes in conditions, as indicated by the selection of “better” (or “higher”), “worse” (or “lower”), or “about the same.” Any index value greater than 100 indicates improving conditions and any value less than 100 indicates deteriorating conditions, regardless of which direction the index is moving. Thus, the index may be increasing in value, but if it lies below 100, it indicates a general assessment of a decline in the number of jobs available to LMI workers. Indexes are created to compare current conditions to those in the previous quarter and the previous year. Survey respondents also are asked to make projections for the quarter ahead. All of the LMI Job Availability Indexes for the Tenth District have improved significantly since the survey was launched in early 2009 at the depths of the recession (Chart 1). Since 2012, the index comparing current job availability to the previous year has remained in positive territory, a sign that survey respondents perceive an increasing availability of jobs in LMI communities. In the fourth quarter survey, the index comparing current job availability to the previous quarter continued to indicate improving labor market conditions, but the sharp decline toward neutral suggests that the pace of improvement had slowed.
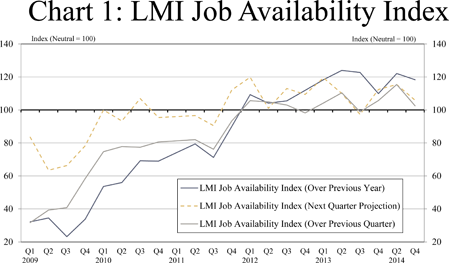
Despite a decline in this index, more data will be needed to confirm any meaningful shift in labor market activity. Results from a single survey period are insufficient to establish a reliable trend. Expectations also shifted back toward neutral, reinforcing other job availability assessments from the survey. Survey respondents comparing current labor market conditions to a year ago continued to report that job availability had increased.
Although perceptions of job availability in LMI communities have improved significantly in recent years, respondents in the fourth quarter survey continued to report low, stagnant wages. Respondents also noted reduced hours for a large number of employed LMI workers and suggested that reduced hours may, in at least some part, reflect efforts of businesses to reduce the (total) cost of providing health benefits under the Affordable Care Act.
Unemployment
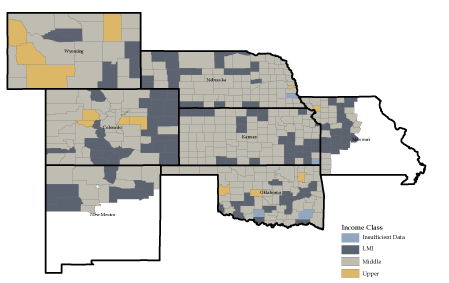
Unemployment rates by income group are not reported in government statistics, and disentangling unemployment and income is difficult. For example, an unemployed worker is likely to have little or no income, and those in low-income families are more likely to be unemployed. If the LMI population is viewed as a community, an analysis of unemployment by income group is more tractable. In this report, unemployment rates by income group are computed using county unemployment rates. Counties are the lowest level of geography in which unemployment rates are reported by the U.S. Bureau of Labor Statistics (BLS). Counties are identified as LMI, middle-income, and upper-income (Map). Quarterly population-weighted averages are calculated for each county income cohort.
Tenth District Counties by Income
Tenth District weighted average unemployment rates by county income cohort typically follow a similar pattern (Chart 2). When the economy contracts or, in some cases, stagnates, county unemployment rates typically rise, regardless of county median income. Generally, these changes in unemployment rates across county income classifications are proportional.
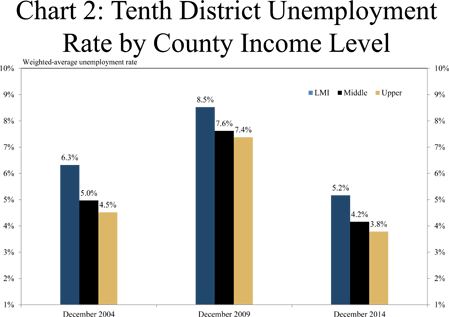
As expected, unemployment rates in LMI counties are persistently much higher than unemployment rates in middle-income and upper-income counties. When the economy was growing and employment was increasing in 2004 and 2014, the weighted-average unemployment rate in upper-income counties was about 30 percent lower than the weighted-average unemployment rate for LMI counties. In economic contractions, LMI and higher-income county unemployment rates were proportionately closer together. The comparable unemployment rate was 5.2 percent in LMI counties in the District. The official unemployment for the nation as a whole (October), across all demographic and socioeconomic classifications, was 5.8 percent, while the District unemployment rate was 4.6 percent_. The differences in unemployment rates across county income cohorts are partly a supply-side issue, specifically structural workforce issues6. Among the structural issues reported by LMI Survey respondents were increasingly expensive childcare, unreliable transportation, skill and readiness issues, income-based reductions in public assistance and criminal histories. Moreover, incomes and unemployment are highly correlated with educational attainment, and residents of LMI counties typically have lower educational attainment than those in higher-income counties. Demand-side issues also are important, as many LMI counties suffer from a dearth of employers, especially those paying relatively high wages. Unemployment rates compiled from the employment situation of individual workers by family income show a similar pattern, but the spread is significantly larger. Specifically, analysis of individual-level CPS data shows the most recent unemployment rate for LMI individuals was 8.6 percent for the United States and 5.8 percent for Tenth District states_.
As noted above, disentangling employment and income—in this case family income—is challenging. In an effort to mitigate this potential problem, unemployment statistics calculated for LMI workers are not compared to similar statistics for middle-income and upper-income families. Comparisons are instead made on the basis of educational attainment and the occupations with which workers identify. LMI workers typically are less educated than workers in other income groups and are more likely to have occupations that require minimal education and training and limited work experience.
The headline unemployment rate (typically the rate reported by the media) masks some important distinctions across situations faced by individual unemployed workers. Importantly, the headline unemployment rate does not indicate the length of time an unemployed worker has been without a job. The labor market circumstances facing long-term unemployed workers, defined by the BLS as workers unemployed for more than 26 weeks, typically are more dire than those for the short-term unemployed. The very long-term unemployed are increasingly losing unemployment compensation benefits, either because of federal or state limits or improvements in labor market conditions that nullify extended benefit programs. They are also much more likely to have exhausted their personal financial resources, such as precautionary savings, retirement accounts and credit.
The long-term unemployed typically also have a much more difficult time securing a new job. Skills may atrophy or become obsolete over time. Employers recognize this potential, which may make them more reluctant to hire the long-term unemployed. In addition, employers may question why after an extended time a worker has been unable to secure another job when others have.
CPS data were used to identify the share of unemployed out of work for 26 or more weeks by family income (for LMI workers), educational attainment, occupation and geography (Chart 3). For LMI workers in the United States, one-third of all unemployed workers are long-term unemployed. The share of long-term unemployed LMI workers in the District is similar at about 31 percent. At the peak of the employment contraction in 2010, over 40 percent of the unemployed were long-term unemployed. Prior to the 2007-09 recession (but post-World War II), the long-term unemployment rate never exceeded 25 percent, even during the relatively severe (double-dip) recession of 1980 and 1982. The high long-term unemployment rate is unique to the most recent recession and will likely continue to be a near-term problem for unemployed workers and general economic activity.
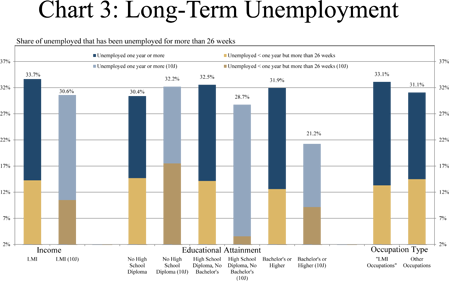
Long-term unemployment rates by educational attainment show surprisingly little variation, with the exception of the highest educated workers in the District. This finding is consistent with other data collected from Tenth District labor markets_, however specifically, 56 percent of the long-term unemployed in the nation have college degrees (including associate degrees), while the comparable figure for the District is 64 percent. Long-term unemployment rates also differed very little across occupation groups.
The rate of long-term unemployment is highly correlated with the overall unemployment rate, the higher the long-term unemployment rate tends to be. But a similar correlation does not exist across educational attainment levels and occupation groups. Among those not in the labor force but who would like to have a job (7.1 percent for the United States), roughly 12.4 percent of those are considered to be discouraged workers_. The BLS defines discouraged workers as those who are not working but want a job, have looked for a job in the past 12 months but not in the past four weeks, and have stopped looking because they do not feel there are any jobs available for which they would qualify. Discouraged workers are a subset of those who are considered to be “marginally attached” to the labor force; that is, those who are willing and able to work and have worked or sought work in the previous 12 months, but are not actively seeking employment. The distinction between discouraged workers and other marginally attached workers is that discouraged workers are not actively seeking a job because they feel a search would be futile.
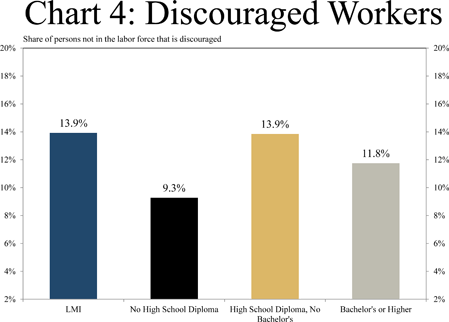
LMI workers are moderately more likely to be discouraged than higher-income workers in the United States (Chart 4). Specifically, 13.9 percent of workers in LMI families who were not in the official labor force but wanted a job were discouraged, compared to 12.4 percent for the nation as a whole. Much of that contrast is due to higher unemployment rates among workers in LMI families.
The share of discouraged workers calculated by educational attainment is interesting given results of other reported labor market statistics, which almost uniformly show less-educated workers to be in “worse shape.” The relatively low share of discouraged workers among those with the least formal education is likely due to the types of jobs commonly taken by this group, such as retail, health care support occupations, and food service. Turnover rates typically are much higher in these industries and occupations_. Churning within these lower-level occupations, as well as significant uniformity in job requirements across employers within occupations, would likely facilitate matching unemployed job seekers with job openings. For more educated workers, loose labor markets are more likely to generate discouragement among job seekers because of increased competition for existing job opportunities. Tenth District statistics are not presented because of a low number of survey responses in the District for some data used in the computation.
Underemployment
While the official unemployment rate (known as U-3) typically captures the most headlines and is most often used to make broad assessments of economic and labor market conditions, most labor market analysts agree this “headline unemployment rate” does not fully capture labor market conditions. In particular, millions of U.S. workers who technically are not part of the labor force would like to have a job. Because they are not in the labor force, they are not counted in determining the official unemployment rate (U-3). Further, among the employed, millions are part-time workers who would prefer a full-time job. Most of these workers are part time for economic reasons, such as slack work opportunities or business conditions.
BLS releases these statistics only for the entire United States and individual states (annual averages released on a quarterly basis). Thus, one cannot readily locate similar data for defined income classes; educational attainment cohorts; occupational classes; or consolidated districts, such as the Tenth District. For this report, raw data from the CPS were used to calculate these statistics for Tenth District states_.
An important component of the underemployed cohort is a significant share of employed people who are working part time but would prefer a full-time job. The BLS considers workers to be “employed” if they are working for pay, regardless of the number of hours they work per week. Part-time employment is defined by the BLS as less than 35 hours a week. Most workers who are employed part time have sought part-time work intentionally. They may want to work only part time to devote more time to family or other pursuits, or they may simply be uninterested in working full time. But many part-time workers would prefer to work full time, but cannot secure a full-time job for economic reasons, such as slack business or economic conditions. To the extent that employed people are working part time for economic reasons, the headline unemployment rate masks the extent of employment difficulties.
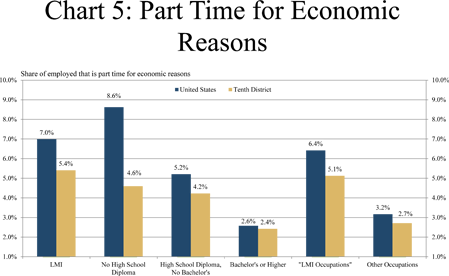
CPS data were used to identify the share of the employed who are working part time for economic reasons (Chart 5). For employed workers in LMI families in the United States, 7.0 percent are working part time for economic reasons, while 5.4 percent of LMI workers are working part time for economic reasons in the Tenth District. By comparison, 4.6 percent of all employed people in the nation are working part time for economic reasons. Consistent with this finding is that 8.6 percent of employed people with less than a high school education are working part time for economic reasons, compared to 5.2 percent for high school graduates (including those with some college or an associate degree) and 2.6 percent for college graduates. Additionally, those in “LMI occupations” are more likely to be part time for economic reasons than are those in other occupations. Consistent with the overall labor market picture in the Tenth District, a smaller share of part-time workers is unemployed than in the rest of the United States.
Higher rates of involuntary part-time employment for those in LMI families, those who are less educated, and those working in “LMI occupations” results substantially from a greater part-time share of lower-skilled jobs.
Underemployment also arises when workers are employed in jobs below their skill level and experience, but data likely could not be collected on this phenomenon at reasonable cost and with reasonable precision.
Endnotes
-
1 In this report, the term “workers” refers to all individuals who are either employed or who are not working and would like to have a job.
-
2 The CPS is a joint effort of the U.S. Bureau of Labor Statistics and the U.S. Census Bureau. The monthly survey of about 60,000 occupied U.S. households is the primary source for U.S. labor statistics, including the official unemployment rate. Extensive demographic data also are collected. The response rate of about 90 percent significantly exceeds the rates for most regular U.S. government surveys. For this report, data from individuals’ survey responses were used to tabulate a variety of labor statistics by income group and for the Tenth District. Equivalent U.S. statistics are provided for comparison.
-
3 The most recent LMI Survey is available on the Kansas City Fed website at https://www.kansascityfed.org/research/indicatorsdata/laborforce.
-
4 Although the survey is now biannual, respondents still are asked to evaluate current conditions relative to the previous (or next) quarter.
-
5 October figures are provided to make them comparable with statistics computed from the CPS microdata.
-
6 The unemployment rate, as used here, includes only unemployed people who are actively seeking employment. For some of the structural impediments to employment, the effect may be to keep workers out of the labor force altogether, in which case they would not be counted as officially unemployed. Nevertheless, labor force participation can indirectly affect the unemployment rate, and some unemployed workers continue to seek employment when obstacles may be seen as nearly insurmountable by some.
-
7 The latest available and accessible CPS microdata were from fourth quarter, 2014. Statistics for the Tenth District, which includes only parts of Missouri and New Mexico, cannot be reliably computed because with only 60,000 CPS responses, insufficient data exist at the county level to provide a reasonable level of confidence in the results. Thus, the CPS does not collect information on county of residence or employment from respondents. The entire states of Missouri, part of which is in the St. Louis District, and New Mexico, part of which is in the Dallas District, are therefore used in these calculations.
-
8 Regional Affairs Department, Federal Reserve Bank of Kansas City.
-
9 The share of discouraged workers is calculated with some modest differences from the share officially released by the BLS. Specifically, “unavailable workers” are excluded in statistics calculated for this report, making the share higher, all else equal.
-
10 Statistics generated by CompDataSurveys. Reports can be found at http://compensation force.com.
-
11 Statistics also were computed for the entire United States over all income classes and other cohorts defined in this report and then compared to similar statistics posted by the BLS to their website. Statistics computed using the CPS data were highly consistent with the official statistics reported by the BLS.
The views expressed are those of the authors and do not necessarily reflect the positions of the Federal Reserve Bank of Kansas City or the Federal Reserve System.