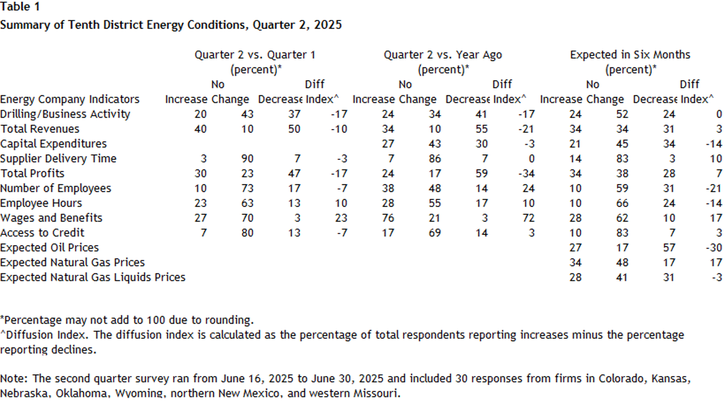
Second quarter energy survey results showed that Tenth District energy activity fell moderately, with no changes expected in the next six months. Firms reported that oil prices needed to be on average $64 per barrel for drilling to be profitable, and $83 per barrel for a substantial increase in drilling to occur. Natural gas prices needed to be $3.79 per million Btu for drilling to be profitable on average, and $5.01 per million Btu for drilling to increase substantially.
Summary of Quarterly Indicators
Tenth District energy activity fell moderately in the second quarter of 2025, as indicated by firms contacted between June 16th, 2025, and June 30th, 2025 (Tables 1 & 2). The quarter-over-quarter drilling and business activity index was -17 in Q2, down from 6 in Q1 and from -13 in Q4 (Chart 1). Revenues and profit continued to decline at -10 and -17, respectively. The employment index also decreased at -7 following previous positive readings.
Drilling activity also decreased from this time last year, with the year-over-year drilling/business activity index ticking up from -18 to -17 in Q2. However, employment continued to increase on an annual basis, staying at a reading of 24. Capital expenditures fell only slightly from last year at -3.
Firms do not expect activity to rebound in the coming six months, with the index falling from 21 to 0 in Q2. Further, revenues are expected to increase minimally while capital expenditures, employment, employee hours, and oil prices are all expected to decline further.
Chart 1. Drilling/Business Activity Indexes
Skip to data visualization table| Quarter | Vs. a Quarter Ago | Vs. a Year Ago |
|---|---|---|
| Q2 21 | 33 | 59 |
| Q3 21 | 43 | 68 |
| Q4 21 | 32 | 74 |
| Q1 22 | 29 | 52 |
| Q2 22 | 57 | 77 |
| Q3 22 | 44 | 78 |
| Q4 22 | 6 | 56 |
| Q1 23 | -13 | 17 |
| Q2 23 | -19 | -16 |
| Q3 23 | -13 | -23 |
| Q4 23 | -33 | -33 |
| Q1 24 | -13 | -26 |
| Q2 24 | -14 | -25 |
| Q3 24 | -13 | -29 |
| Q4 24 | -13 | -16 |
| Q1 25 | 6 | -18 |
| Q2 25 | -17 | -17 |
Summary of Special Questions
Firms were asked what oil and natural gas prices were needed on average for drilling to be profitable across the fields in which they are active. The average oil price needed was $64 per barrel (Chart 2), while the average natural gas price needed was $3.79 per million Btu (Chart 3). Firms were also asked what prices were needed for a substantial increase in drilling to occur across the fields in which they are active. The average oil price needed was $83 per barrel (Chart 2), and the average natural gas price needed was $5.01 per million Btu (Chart 3).
Firms reported what they expected oil and natural gas prices to be in six months, one year, two years, and five years. The average expected WTI prices were $67, $67, $71, and $79 per barrel, respectively. The average expected Henry Hub natural gas prices were $3.76, $3.85, $4.19, and $4.71 per million Btu, respectively.
Firms were asked how they have changed their inventories if they have adjusted their inventories strategy (Chart 4). Most firms (70%) have not adjusted their inventories strategy. Nearly a fifth (19%) of firms reported they have adjusted their strategy and have higher inventories, while 4% each reported unchanged, lower, and significantly lower inventories.
Contacts were also asked how their firms’ capital expenditures plans have changed since the start of the year (Chart 5). About a tenth (11%) reported increasing plans for capital expenditures compared to the beginning of the year while 46% reported decreasing plans for capital expenditures. Another 43% reported their capital expenditures plans have not changed.
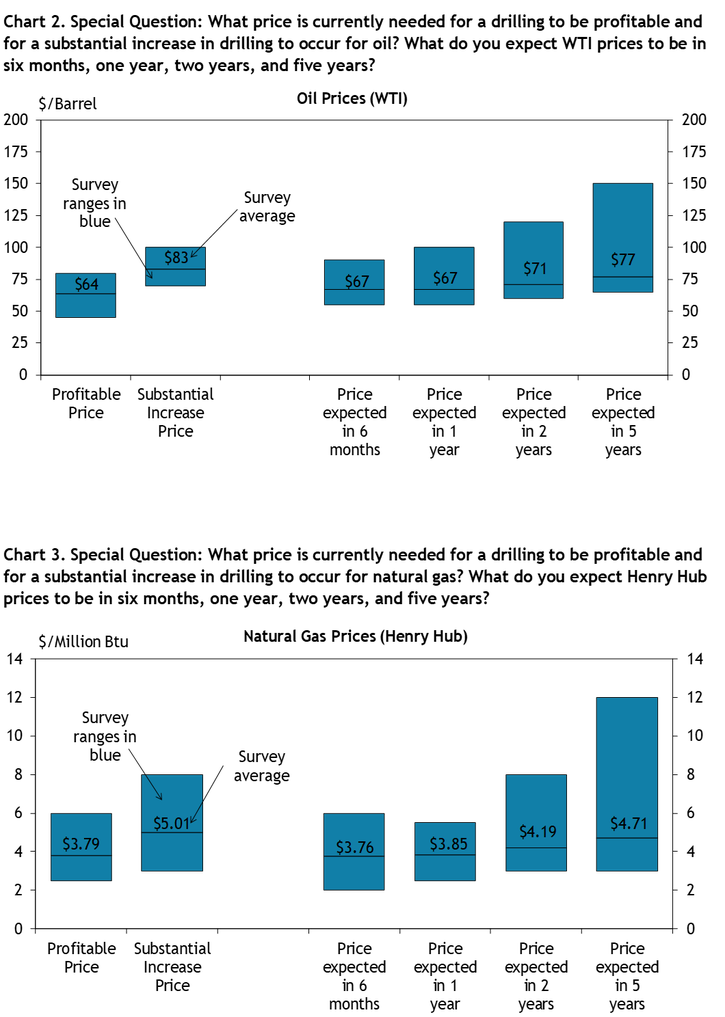
Chart 4. Special Question: If you have adjusted your inventory strategies, how have your inventories changed?
Skip to data visualization table| Category | Percent |
|---|---|
| Significantly Lower | 4 |
| Lower | 4 |
| No Change | 4 |
| Higher | 19 |
| Significantly Higher | 0 |
| We have not adjusted inventories | 70 |
Chart 5. Special Question: Since the start of the year, have your firm's capital expenditure plans changed for the remainder of 2025?
Skip to data visualization table| Category | Percent |
|---|---|
| Yes – increase capital expenditures | 11 |
| Yes – decrease capital expenditures | 46 |
| Our capital expenditures have not changed | 43 |

Selected Energy Comments
“Energy demand is still increasing, and output is stagnating due to a downturn in investment.”
“Supply and demand imbalances, currently headed toward an oversupply situation with building global inventories, but inventories could tighten significantly by the end of the decade due to lack of global exploration.”
“So much of natural gas prices are now weather bets.”
“Demand is increasing for power generation and LNG exports.”
“Natural gas will need to be utilized more in order to generate electricity. Natural gas is cleaner burning than coal and abundant.”
“Current natural gas prices are stronger than the last few years, which will encourage drilling in the mid-term. The increased production that results softens prices longer term.”
“Capital will flow to dry gas areas if above $3.50.”
Additional Resources
The views expressed are those of the authors and do not necessarily reflect the positions of the Federal Reserve Bank of Kansas City or the Federal Reserve System.
Authors

Megan Williams
Associate Economist and Senior Manager