Third quarter energy survey results showed that Tenth District energy activity continued to decline, with no changes expected in the next six months. Firms reported that oil prices needed to be on average $63 per barrel for drilling to be profitable, and $78 per barrel for a substantial increase in drilling to occur. Natural gas prices needed to be $3.56 per million Btu for drilling to be profitable on average, and $4.64 per million Btu for drilling to increase substantially.
Summary of Quarterly Indicators
Tenth District energy activity continued to decline in the third quarter of 2025, as indicated by firms contacted between Sept. 15, 2025, and Sept. 30, 2025 (Tables 1 & 2). The quarter-over-quarter drilling and business activity index was -16 in Q3, up from -17 in Q2 and down from 6 in Q1 (Chart 1). Revenues and profits fell to their lowest levels in two years, at -24 and -29 respectively. The number of employees fell for the second consecutive quarter, and employee hours fell from 10 to -26.
Drilling activity also decreased from this time last year, with the year-over-year drilling/business activity index falling from -17 to -24 in Q3. Employment levels fell from the previous year for the first time since Q1 2021, with a reading of -8. More firms reported decreasing capital expenditures on net compared to last quarter, with the index declining from -3 to -18.
Firms still do not anticipate a rebound in drilling activity or capital expenditures in the next six months, as their expectations indexes remained at 0. Further, firms only expect modest increases in revenues and profits while employment is expected to fall further.
Chart 1. Drilling/Business Activity Indexes
Skip to data visualization table| Quarter | Vs. a Quarter Ago | Vs. a Year Ago |
|---|---|---|
| Q3 21 | 43 | 68 |
| Q4 21 | 32 | 74 |
| Q1 22 | 29 | 52 |
| Q2 22 | 57 | 77 |
| Q3 22 | 44 | 78 |
| Q4 22 | 6 | 56 |
| Q1 23 | -13 | 17 |
| Q2 23 | -19 | -16 |
| Q3 23 | -13 | -23 |
| Q4 23 | -33 | -33 |
| Q1 24 | -13 | -26 |
| Q2 24 | -14 | -25 |
| Q3 24 | -13 | -29 |
| Q4 24 | -13 | -16 |
| Q1 25 | 6 | -18 |
| Q2 25 | -17 | -17 |
| Q3 25 | -16 | -24 |
Summary of Special Questions
Firms were asked what oil and natural gas prices were needed on average for drilling to be profitable across the fields in which they are active. The average oil price needed was $63 per barrel (Chart 2), while the average natural gas price needed was $3.56 per million Btu (Chart 3). Firms were also asked what prices were needed for a substantial increase in drilling to occur across the fields in which they are active. The average oil price needed was $78 per barrel (Chart 2), and the average natural gas price needed was $4.64 per million Btu (Chart 3). Firms reported what they expected oil and natural gas prices to be in six months, one year, two years, and five years. The average expected WTI prices were $63, $65, $69, and $76 per barrel, respectively. The average expected Henry Hub natural gas prices were $3.37, $3.65, $3.98, and $4.39 per million Btu, respectively.
Firms were asked if they have delayed investment decisions this year in response to heightened uncertainty (Chart 4). Nearly half (47%) of firms reported slightly delaying investment decisions due to uncertainty, while a quarter reported delaying decisions significantly. An additional 25% of firms have not delayed investment decisions due to uncertainty, and 3% reported no opinion.
Contacts were also asked what share of their oil and gas production is hedged in 2025, and how much they plan to hedge in 2026. Chart 5 shows the median share of production that is/will be hedged among the firms that reported hedging. The median firm has hedged 45% of oil production in 2025 and plans to hedge 40% in 2026. Additionally, the median firm reported hedging 50% of natural gas production in 2025 and plans to hedge 33% in 2026.
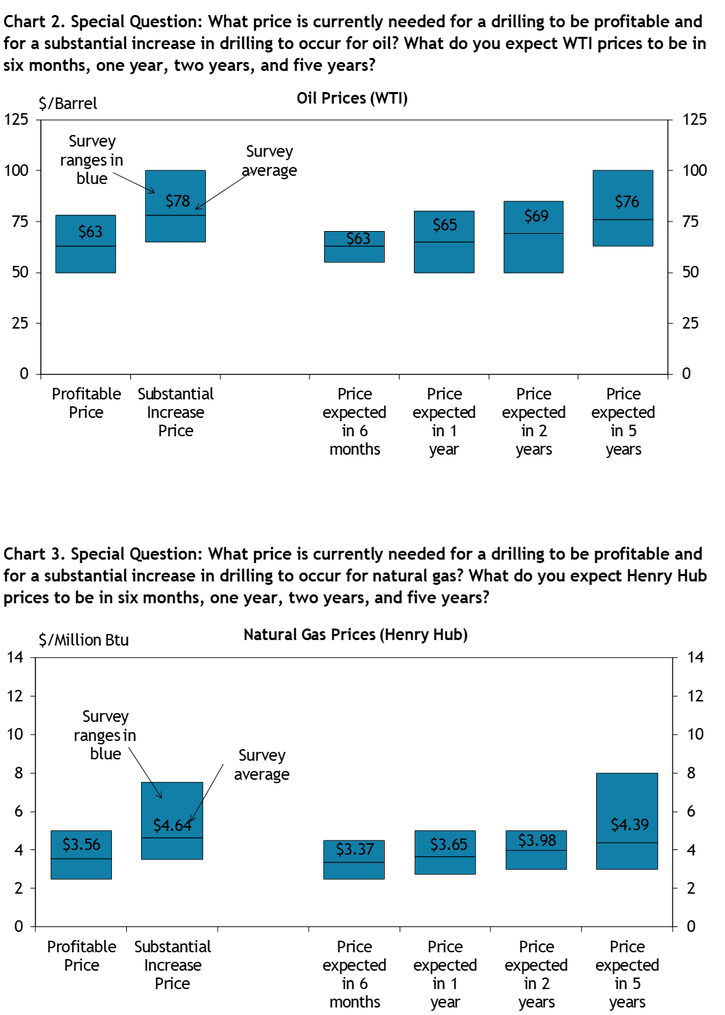
Chart 4. Special Question: Has your firm delayed investment decisions this year in response to heighted uncertainty about energy, trade, or regulatory policy?
Skip to data visualization table| Category | Percent |
|---|---|
| Yes, significantly | 25 |
| Yes, slightly | 47 |
| No | 25 |
| No opinion/don’t know | 3 |
Chart 5. Special Question: Median share of production that is hedged in 2025 and planned to hedge in 2026 (among firms that reported hedging)
Skip to data visualization table| Category | In 2025 | In 2026 |
|---|---|---|
| Oil | 45 | 40 |
| Natural Gas | 50 | 33 |
Selected Energy Comments
“Tremendous uncertainty in the markets currently, which has a negative effect on investment decisions for the industry.”
“The current price of oil is equivalent to approximately $45 oil in 2016-2017. We are going to have to start laying off people soon if the price doesn't change. We are losing money producing oil. All fixed costs have gone up (materials, pipe, pumps, chemical) and they will not recess. Also, our price of labor has increased significantly to keep up with inflation.”
“There is no funding, no investors, and no capital available for drilling and mining. No new leases available.”
“We continue to be bullish on the future of the fossil fuel industry in the years to come.”
“We believe shale production is maturing and that will place upward pressure on oil prices.”
“OPEC continues to raise production rate and building world inventories.”
“Natural gas is a weather bet. We need a cold winter for $4 natural gas prices and that is a rarity. We can build supply at $3.50 pricing significantly in the U.S. if needed within 6-9 months.”
“There will be occasional natural gas price spikes in the next 5 years, but nothing sustained because of global supply outpacing demand. As surplus natural gas from the Permian basin is monetized by LNG exports, domestic prices will increase steadily to match global demand and prices.”
“Current pricing is not enough incentive to keep up with fast growing demand for LNG and then power generation. Gas supply growth is very dependent on infrastructure development and oil focused drilling in Permian.”
Additional Resources
Current Release
Download Historical Data
About the Energy Survey
The views expressed are those of the authors and do not necessarily reflect the positions of the Federal Reserve Bank of Kansas City or the Federal Reserve System.
Authors

Cortney Cowley
Assistant Vice President and Oklahoma City Branch Executive