Summary of Quarterly Indicators
Tenth District energy activity accelerated slightly in the fourth quarter of 2017, as indicated by firms contacted between December 15th and January 5th (Tables 1 & 2). Most quarterly indexes increased in the fourth quarter. The drilling and business activity index rose from 7 to 13 (Chart 1). The revenues and employee hours indexes increased considerably. The wages and benefits and profits indexes grew moderately, and the supplier delivery time index rose to –4. The employment index edged higher. However, the access to credit index fell to zero.
Chart 1. Drilling/Business Activity Index vs. a Quarter Ago
Skip to data visualization table| Date | Drilling/Business Activity |
|---|---|
| 2015Q1 | -68 |
| 2015Q2 | -37 |
| 2015Q3 | -37 |
| 2015Q4 | -56 |
| 2016Q1 | -72 |
| 2016Q2 | 0 |
| 2016Q3 | 26 |
| 2016Q4 | 64 |
| 2017Q1 | 55 |
| 2017Q2 | 43 |
| 2017Q3 | 7 |
| 2017Q4 | 13 |
| 2018Q1 | 37 |
Most year-over-year indexes also increased. The revenues, profits, and employment indexes were considerably higher. The drilling and business activity posted a moderate increase, while the supplier delivery time index rose but remained negative. The year-over-year capital expenditures index was unchanged. On the other hand, the wages and benefits index fell slightly, and the access to credit index slipped from 20 to 7.
Expectations continued to improve. The future wages and benefits index was significantly higher, and the profits and employee hours indexes also grew moderately. The future capital expenditures, access to credit and drilling and business activity indexes rose slightly. The future employment index inched up, while the revenues and supplier delivery time indexes were unchanged. Price expectations for oil and gas remained solid.
Summary of Special Questions
Firms were asked what oil and natural gas prices were needed for a substantial increase in drilling to occur in the areas in which they were active. The average oil price needed increased to $62 per barrel, with a range of $50 to $75 (Chart 2). The average natural gas price needed was $3.59 per million Btu, with responses ranging from $2.25 to $5.00.
Chart 2. Special Question - What price is currently needed for a substantial increase in drilling to occur for oil and natural gas, and what do you expect the WTI and Henry Hub prices to be in six months, one year, two years, and five years?
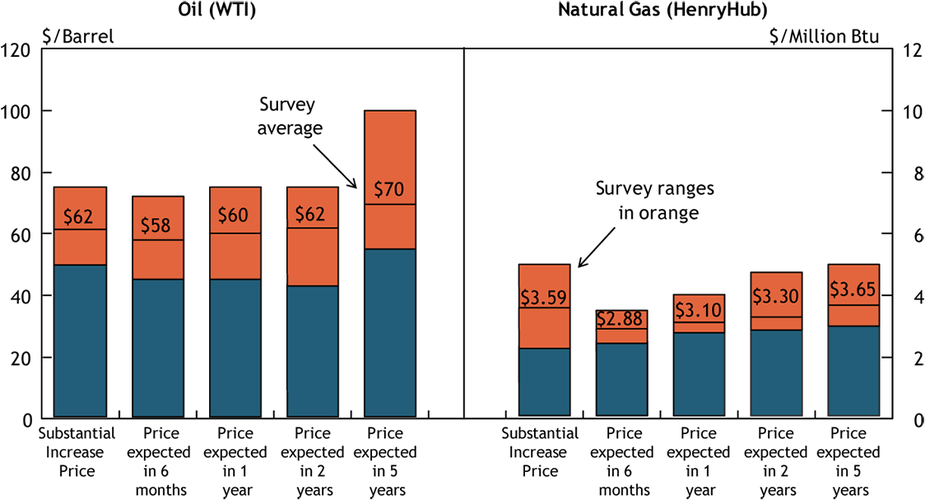
Firms were also asked what they expected oil and natural gas prices to be in six months, one year, two years, and five years. Oil price expectations continued to increase modestly, while natural gas price expectations were marginally lower. The average expected WTI prices were $58, $60, $62, and $70 per barrel, respectively. The average expected Henry Hub natural gas prices were $2.88, $3.10, $3.30, and $3.65 per million Btu, respectively.
Firms were asked how spending in 2018 was expected to change in several categories compared to 2017. On average, spending was expected to increase across all categories. Capital spending for exploration and development was expected to increase the most followed by R&D (Chart 3). Maintenance capital spending was expected to increase modestly, while labor/wages/benefits, administrative, and other categories were expected to grow slightly.
Chart 3.
Special Question: How do you expect spending to increase/decrease (in percentage terms) in each of the following categories in 2018 versus 2017?
Skip to data visualization table| Level | Percent |
|---|---|
| None | 8 |
| Low | 54 |
| Medium | 35 |
| High | 4 |
Additionally, firms were asked what risks they face from renewable energy and electric vehicles (EVs) within the next 10 to 20 years. Almost half of firms said they faced low risks, while slightly more than a third said medium risks (Chart 4). Several respondents mentioned that the rate of adoption of EVs is limited by declining tax credits, support infrastructure, and battery range. Only a few firms said they faced high risk.
Chart 4.
Special Question: What risks does your business face from renewable energy and Electric Vehicles (EVs) within the next 10 to 20 years?
Skip to data visualization table| Risk | None | Low | Medium | High |
|---|---|---|---|---|
| Unskilled Labor | 38 | 27 | 35 | 0 |
| Skilled Labor | 8 | 27 | 54 | 12 |
| Logistics* | 12 | 31 | 42 | 15 |
| Equipment** | 8 | 40 | 36 | 16 |
| Inputs*** | 13 | 30 | 39 | 17 |
| Financing | 27 | 38 | 27 | 8 |
Firms were asked how their business has been affected since the lifting of the oil export ban. More than half of respondents have seen positive effects. Several said price differentials due to oil quality differences narrowed, notably for light sweet oil.
Lastly, firms were asked how the proposed tax bill was expected to impact them. Nearly three-fourths expected a slightly positive impact. The immediate impact was the lower corporate tax rate, which some said would help expand drilling.
Table 1 - Summary of Tenth District Energy Conditions, Quarter 4, 2017

Source: Federal Reserve Bank of Kansas City
Table 2 - Historical Energy Survey Indexes

Source: Federal Reserve Bank of Kansas City
Selected Comments
“There has not been enough exploration work to find new reserves. At some point companies will need to spend more. They cannot continue producing indefinitely at this price.”
“I see an abundant supply of natural gas here in the U.S. With the ability to export I see prices gradually increasing.”
“We are trying to maintain a consistent level of activity, which gives us operational efficiency. Commodity prices appear to have stabilized at a level that allows for medium term planning.”
“A lower corporate and personal income tax will help add dollars to more exploration and production and drilling.”
“Energy demand will increase as the economy expands and re-investment in manufacturing accelerates. Sooner or later infrastructure investment will be required, which requires additional energy.”
“The ability to let light crude oil be exported removed a refining differential and equalized the market. However, the excess amount of light crude oil probably hasn’t been as substantial due to the past three years of lower prices.”
“We are carefully watching the adoption of Electric Vehicles. We are less threatened by market forces than we are by government regulation. The risk to oil demand will come from national and local governments mandating electric vehicle adoption.”
“Subsidized wind and solar energy competes with natural gas and will create downward pricing pressure. However, a reduced oil and gas tax base will require renewables to pay their fair share of tax, thereby leveling the playing field over the 10 to 20 year time frame. Electric vehicle growth will be limited for the next 10 years due to inadequate support infrastructure.”
Additional Resources
The views expressed are those of the authors and do not necessarily reflect the positions of the Federal Reserve Bank of Kansas City or the Federal Reserve System.
Author