The zero lower bound—a natural limit on the extent to which interest rates can be reduced—has been instrumental in shaping U.S. monetary policy in recent decades. However, since the pandemic recovery, the interest rate landscape has begun to change. Estimates of where the federal funds rate will settle over the longer run have moved higher, and financial markets are pricing lower odds of future encounters with the zero lower bound. Understanding the forces behind these changes is important for judging whether they signal a fleeting or lasting change to the interest rate environment.
In this article, Brent Bundick and A. Lee Smith review how factors that determine the longer-run normal level of interest rates have evolved since the pandemic. They find that a large increase in the stock of U.S. government debt, viewed as a safe asset across the world, has likely contributed to the apparent increase in the normal level of interest rates since 2020. Their results suggest that if the supply of government debt remains elevated relative to demand, the risk of encounters with the zero lower bound could remain lower than in recent decades.
Introduction
The zero lower bound—a natural limit on the extent to which interest rates can be reduced—has been instrumental in shaping U.S. monetary policy in recent decades. To support the economy during the fallout from the 2007–09 global financial crisis and the COVID-19 pandemic, the Federal Open Market Committee (FOMC) set the federal funds rate to near zero. Combined, these two spells of near-zero interest rates lasted roughly nine years, leading to prolonged periods during which the FOMC was unable to provide further accommodation through reductions in the federal funds rate.
In hindsight, these periods of ultra-low interest rates reflected not just the fallout of two severe recessions, but also a steady decline in the longer-run normal level of interest rates. When interest rates are low in normal economic conditions, even modest disruptions in the economy can easily push interest rates toward zero, posing challenges for policymakers to respond to economic downturns. This risk of hitting the zero lower bound has been instrumental in shaping monetary policy over the past decade, leading the FOMC to pursue new policies to stimulate the economy, revamp its operating framework for controlling interest rates, and adopt a new strategy for achieving its dual mandate objectives of price stability and maximum employment.
However, since the pandemic recovery, the interest rate landscape has begun to change. Estimates of where the federal funds rate will settle over the longer run have moved higher, and financial markets are pricing lower odds of future encounters with the zero lower bound. Understanding the forces behind these changes is important for judging whether they signal a fleeting or lasting change to the interest rate environment.
In this article, we review how factors that determine the longer-run normal level of interest rates have evolved since the pandemic. We find that a large increase in the stock of U.S. government debt, viewed as a safe asset across the world, has likely contributed to the apparent increase in the normal level of interest rates since 2020. Our results suggest that if the supply of government debt remains elevated relative to demand, the risk of encounters with the zero lower bound could remain lower than in recent decades.
Section I reviews some of the forces that contributed to the decline in the longer-run normal level of interest rates and the increased encounters with the zero lower bound in the decades before the pandemic. Section II presents evidence that zero lower bound risk has receded since the pandemic, as both financial markets and professional forecasters predict that the longer-run normal level of interest rates has moved higher. Section III presents analysis based on historical patterns that the large increase in the supply of government debt since 2020 may be an important factor lifting interest rates and in turn reducing the risk of encounters with the zero lower bound.
I. Declining Interest Rates and Growing Risk of the Zero Lower Bound Before the Pandemic
The federal funds rate, the FOMC’s primary monetary policy instrument, steadily declined in the decades prior to the COVID-19 pandemic. Chart 1 shows the target federal funds rate set by the FOMC since 1982. Both cyclical and trend forces drive movements in interest rates. The federal funds rate regularly declines around recessions (gray shaded regions) as policymakers reduce interest rates to stimulate economic activity, boost hiring, and reduce unemployment. Conversely, the funds rate typically increases during expansions, often to contain inflationary pressures. However, the labels in Chart 1 indicate that in the four decades prior to the pandemic, the peak funds rate in each expansion was lower than the peak in the previous expansion.
Chart 1: The Federal Funds Rate Trended Lower in the Four Decades Prior to the Pandemic
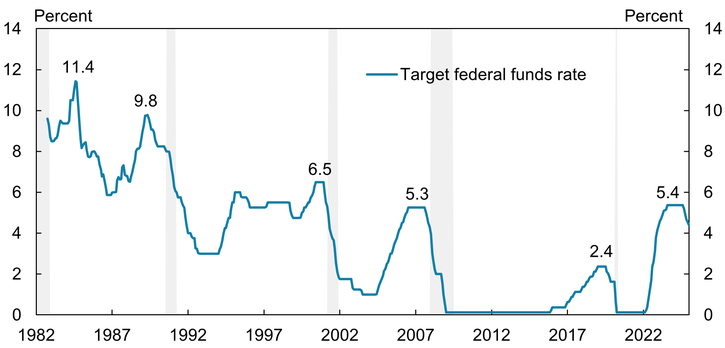
Note: Gray bars denote National Bureau of Economic Research (NBER)-defined recessions.
Sources: Board of Governors of the Federal Reserve System and NBER (both accessed via Haver Analytics).
This pattern of successively lower highs for the funds rate reflected a decline in the longer-run normal level of the federal funds rate. The longer-run normal level of the federal funds rate can be thought of as the interest rate that would prevail if the economy were operating on an even keel, neither creating inflationary pressures nor in recession._ Embedded in any interest rate is compensation for expected inflation, and the decades-long decline in the federal funds rate partly reflects the steady decline in both inflation and inflation expectations from the 1980s through the 2010s. However, Chart 2 shows that even after adjusting for inflation, forecasts and Treasury market measures of longer-term real interest rates moved lower from the 1980s through the 2010s.
Chart 2: Forecasts and Treasury Market Measures of Real (Inflation-Adjusted) Longer-Run Interest Rates Also Declined in the Decades Prior to the Pandemic
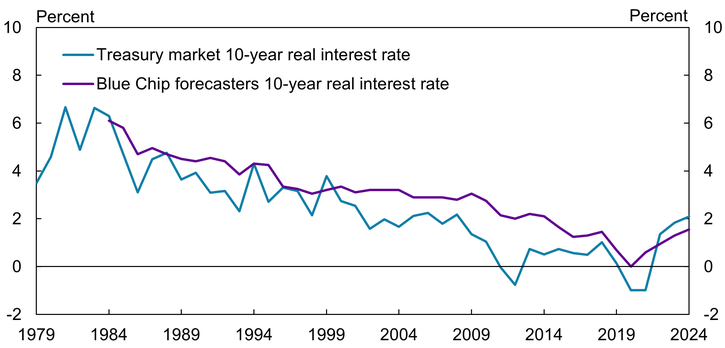
Notes: Before 2001, the Treasury market 10-year real interest rate is calculated as the 10-year Treasury yield less 10-year expected CPI inflation from the Survey of Professional Forecasters. After 2001, the Treasury market 10-year real interest rate is computed from Treasury Inflation-Protected Securities (TIPS) yields. The Blue Chip 10-year real interest rate is calculated from the annual long-range U.S. consensus economic projections.
Sources: Survey of Professional Forecasters, Board of Governors of the Federal Reserve System, and Blue Chip/Wolters Kluwer (all accessed via Haver Analytics); authors’ calculations.
In standard economic models, the longer-run normal level of real interest rates is determined by non-monetary forces—namely, the balance between savings and investment. Intuitively, a large surplus of savings and a lack of investment will tend to push down interest rates, as the supply of savings overwhelms demand from firms to finance investment. Shifts in the supply of savings can arise from households, businesses, or the government. For example, increases in government debt could reduce the supply of savings available for private investment and thereby lift the real interest rate. Within this framework, several factors have been linked to the multi-decade decline in U.S. interest rates before the pandemic, including a subdued pace of productivity growth, slowing population growth, and an increase in global savings.
Aside from a temporary burst of productivity growth in the late 1990s related to the information technology (IT) revolution, productivity growth was fairly subdued in the United States from the 1970s until the pandemic (Fernald and Wang 2015). Less innovation tends to reduce demand for firms to invest in new capital and equipment, depressing interest rates. At the same time, when households expect slower innovation and hence slower future wage gains, they have an incentive to save more, which further pushes down interest rates.
Slower population growth and an aging demographic may also have dampened interest rates. Chart 3 illustrates that population growth has been slowing in the United States since the post-World War II baby boom. As population growth slows, the pace of economic growth slows as well, reducing incentives for firms to invest in new offices, plants, and equipment, thereby depressing interest rates. The demographic makeup of the population can also shape interest rates. The share of the prime-age (25 to 54) working population has been declining since the 1990s as baby boomers age into retirement. An aging population generally puts downward pressure on interest rates by driving up the supply of savings in preparation for retirement. Moreover, many retirees are slow to spend down savings and some even continue to accumulate savings in retirement (De Nardi and others 2021).
Chart 3: Population Growth Has Been Slowing in the United States Following the Post-World War II Baby Boom
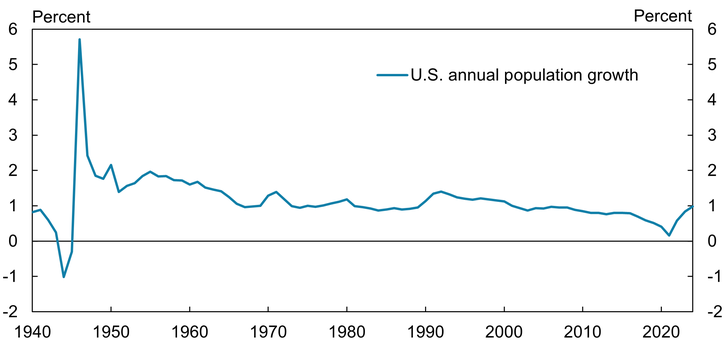
Source: U.S. Census Bureau (Haver Analytics).
Bernanke (2005) argues that the decline in U.S. interest rates partly resulted from a glut of global savings flooding into the United States beginning in the mid-1990s.In the aftermath of the 1997 Asian financial crisis, many governments in Asia built up official savings to bolster their foreign reserve positions, concentrated in U.S. dollars. Middle East oil producers similarly built up large foreign reserve positions as revenue swelled amid high oil prices. The savings of foreign governments were concentrated in the safest assets, particularly U.S. Treasury and U.S. government agency debt, depressing U.S. interest rates (Bernanke and others 2011; Barsky and Easton 2021). As the supply of global savings was growing in the late 1990s, the U.S. government debt-to-GDP ratio was shrinking, reflecting government surpluses amid strong economic growth. The decline in U.S. interest rates therefore reflected, in some sense, a shortage of the safe assets desired by international investors.
By the early 2000s, the extent of the decline in interest rates left the economy more vulnerable to zero lower bound risk. A deflation scare in 2003 led the FOMC to cut the federal funds rate to just 1 percent—a historically low level at the time—raising concern among some Committee members that the Federal Reserve would be constrained in its ability to ease monetary policy should conditions worsen (Board of Governors 2003)._ The risk of the zero lower bound fully materialized in the aftermath of the global financial crisis (GFC), when the FOMC set the target federal funds rate to an all-time low of 0–0.25 percent in December 2008. The recession formally ended in 2009, but the economic recovery from the GFC proved tepid. The slow recovery persisted despite the funds rate remaining near zero for seven full years, an early indication that low interest rates were not all that accommodative but rather reflected a decline in the longer-run normal level of interest rates in the economy.
Following the GFC, policymakers cited several headwinds that were thought to be temporarily depressing the normal level of interest rates, including household deleveraging, contractionary fiscal policy, and elevated uncertainty (see Yellen 2015). In 2012, the Committee projected that the longer-run normal level of the federal funds rate was 4.3 percent, suggesting the headwinds keeping rates low would eventually fade and give way to higher interest rates. However, over the course of the 2010s, the FOMC’s projections for the longer-run funds rate gradually declined as the combination of low rates, slow growth, and low inflation persisted. By 2019, the FOMC reached the conclusion that even in the longer run, the federal funds rate would settle at a mere 2.5 percent, suggesting the U.S. economy could not sustain its potential level of economic activity without historically low interest rates.
With interest rates expected to hover just a few percentage points above zero even in normal economic conditions, the risk of the funds rate being constrained by the zero lower bound increased._ This growing zero lower bound risk was one of the rationales for the FOMC adopting a new framework for interest rate control. In 2019, the Committee formally adopted an ample reserves framework for interest rate control, which the Fed had largely been implementing since conducting large-scale asset purchases in 2009. A key benefit of the ample reserves framework is that it allows the FOMC flexibility to expand the Fed’s balance sheet through large-scale asset purchases while maintaining firm control of the federal funds rate, effectively giving the Committee an independent instrument to stimulate the economy when the funds rate is constrained by the lower bound._
In the summer of 2020, the FOMC concluded that greater risk of the zero lower bound also necessitated a new monetary policy strategy to achieve its dual mandate. After a public review that was initiated prior to the onset of the pandemic, the FOMC revised its Statement on Longer-Run Goals and Monetary Policy Strategy to note that growing risk of the zero lower bound posed downside risks to inflation and economic activity. To partially offset this risk, the Committee adopted a flexible average inflation targeting strategy that acknowledged that encounters with the zero lower bound could lead to periods of low inflation that the Committee would aim to counteract with a subsequent period of moderately higher inflation. When Chair Powell announced this new strategy in August 2020 at the Federal Reserve Bank of Kansas City's Jackson Hole Economic Policy Symposium, PCE inflation was running near 1 percent, the unemployment rate was above 10 percent, and the federal funds rate was sitting near zero.
II. Reassessing Zero Lower Bound Risk and the Interest Rate Environment Post-Pandemic
Despite the severity of the pandemic recession, and in sharp contrast to the post-GFC recovery, the post-pandemic recovery was marked by rapid growth and a surge in inflation. Because the recovery began in 2021 while interest rates were still near zero, it was initially not widely believed that the normal level of interest rates had increased. However, by 2023, the FOMC had raised the federal funds rate to over 5 percent, the highest level of the policy rate since 2005. At the same time, economic growth proved resilient, and unemployment remained low.
The strong performance of the economy despite the highest level of the funds rate in nearly 20 years suggests that the longer-run normal level of interest rates may have increased post-pandemic. For example, professional forecasts and Treasury market measures of longer-run interest rates have moved higher since 2019:Q4 (see Chart 2). Although the magnitude of the increase varies, survey forecasts and market-based measures suggest that real interest rates (interest rates less expected inflation) will not settle at the very low levels witnessed for much of the 2010s. Consistent with the view that the normal level of the federal funds rate has increased, Chart 4 shows that the market-implied path of short-term policy interest rates far into the future has also shifted higher since just before the pandemic. These far-forward interest rate futures contracts suggest short-term U.S. interest rates will settle around 4 percent post-pandemic (purple line), up from 2 percent just before the pandemic (blue line). This rise in market-based measures of expected short-term interest rates appears to reflect rising real, or inflation-adjusted, interest rates in the future. Specifically, five-year, five-year forward inflation-protected (TIPS) yields increased from an average of just 0.3 percent in 2019:Q4 to an average of 2.2 percent in 2024:Q4.
Chart 4: The Market-Implied Path of Future Policy Rates Has Shifted Higher Since Just Before the Pandemic
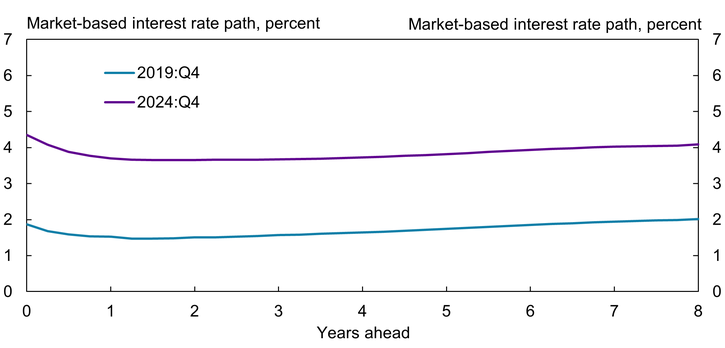
Notes: Values reflect the market-implied expected value of the three-month LIBOR/SOFR rate at each horizon in the future based on Eurodollar/SOFR futures. Quarterly values are constructed by averaging daily closing values within the quarter for each horizon.
Sources: CME Group and authors’ calculations.
Financial markets are also pricing lower odds of a future encounter with the zero lower bound compared with just prior to the pandemic. Chart 5 shows the market-implied probability that the federal funds rate will reach the zero lower bound at various horizons in the future. Bundick, Hotz, and Smith (2025) calculate these probabilities using data from options contracts on interest rate futures._ We extend their methodology here to include more recent data and various horizons of options contracts. Prior to the pandemic, investors had placed a roughly 20 percent probability of being at the zero lower bound in two years (eight quarters). More recently, that probability has meaningfully declined. As of 2024:Q4, financial markets are pricing just a 4 percent probability that the federal funds rate will reach the zero lower bound two years in the future._
Chart 5: Risk of Future Encounters with the Zero Lower Bound Has Receded Since 2019
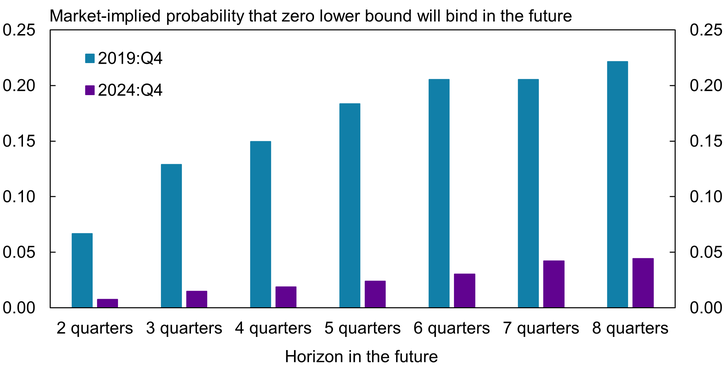
Note: Quarterly values are constructed by averaging daily closing values within the quarter for each horizon.
Sources: CME Group and authors’ calculations.
Chart 6 shows a longer historical sample of the market-implied probability that the funds rate will reach the zero lower bound six quarters in the future (blue line) alongside the target federal funds rate (purple line). As should be expected, the two series are inversely related. When the federal funds rate approaches lower levels, the probability that the funds rate will be at the lower bound in the future increases. The first close call with the zero lower bound in 2003 is apparent when the target funds rate reaches 1 percent and the probability of reaching the zero lower bound spikes.
Chart 6: Risk That the Zero Lower Bound Will Bind in the Future Typically Declines as the Federal Funds Rate Moves Higher
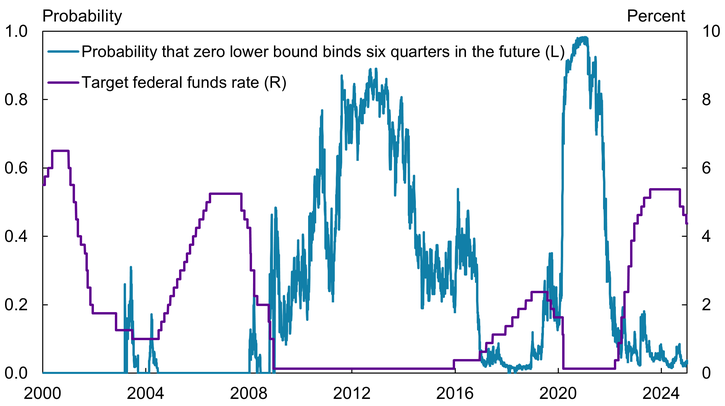
Sources: CME Group, Board of Governors of the Federal Reserve System (Haver Analytics), and authors’ calculations.
After the GFC, interest-rate futures and options markets suggested that investors expected rates would lift off from zero relatively quickly. However, as the recovery continued to be sluggish, markets began to price in greater odds of lower-for-longer policy rates. By 2014, markets began positioning for lift-off, and the probability of near-zero policy rates declined. Following the pandemic, the likelihood of rates remaining near zero spiked again before falling almost as quickly as inflation surged.
The contrast between the post-GFC and post-pandemic tightening cycles illustrates how the interest rate environment appears to have shifted post-pandemic. Increases in the federal funds rate after the GFC were slow and modest, with the funds rate peaking around 2.5 percent in 2018. However, by early 2019, the unemployment rate had started to tick higher, inflation moved further below 2 percent, and financial conditions tightened. The FOMC subsequently lowered the funds rate by 0.75 percentage points in 2019 and marked down its assessment of the longer-run normal funds rate to just 2.5 percent. Chart 6 shows that throughout 2019, the market-implied probability of rates returning to the zero lower bound in the next six quarters also increased, peaking at nearly 35 percent in early October 2019 (blue line) following the release of weaker-than-expected data. In contrast, the post-pandemic tightening cycle saw a rapid and large increase in the federal funds rate, with the funds rate peaking around 5.5 percent (purple line). By the end of 2024, the funds rate had fallen to 4.5 percent, with unemployment low, financial conditions accommodative, and inflation still running above 2 percent. As of 2024:Q4, the odds of encountering the zero lower bound in the next six quarters stood below 5 percent.
III. What Is Behind the Shifting Interest Rate Environment Post-Pandemic?
The apparent rise in the longer-run normal level of interest rates suggests that at least one of the factors behind its decline—slowing population growth, subdued productivity growth, or an increase in global savings that boosted demand for government debt—may have partially reversed. However, population growth in particular is typically slow to adjust. As noted previously, U.S. population growth has been on a downward trend since the baby boom. More recently, the pace of population growth fell sharply in the immediate aftermath of the pandemic and remained low until 2024, when it ticked up, reflecting increases in immigration. Despite the tick higher in 2024, the U.S. Census Bureau projects population growth will stagnate in the decades to come.
Unlike demographics, productivity can shift quickly amid new innovations. While labor productivity growth has remained relatively stable in the years since the pandemic, emerging technologies, including generative AI, have led to speculation among some that labor productivity could increase significantly in the future. Çakır Melek and Gallin (2024) argue that while a boom in productivity growth is far from assured, there are reasons to be cautiously optimistic about future productivity growth. Despite some of this optimism, professional forecasters have yet to incorporate a sustained increase in productivity growth into their outlooks. Chart 7 shows that professional forecasts for both real GDP growth (blue line) and productivity growth (purple line) over the next decade remain near their pre-pandemic levels of 2 percent and 1.5 percent, respectively. These low growth forecasts suggest that forecasters see productivity gains from emerging technologies as likely to be temporary, as was the case with the IT revolution of the late 1990s and early 2000s, rather than long-lasting.
Chart 7: Forecasts for Both Real GDP Growth and Productivity Growth Far into the Future Remain Near Their Pre-Pandemic Levels
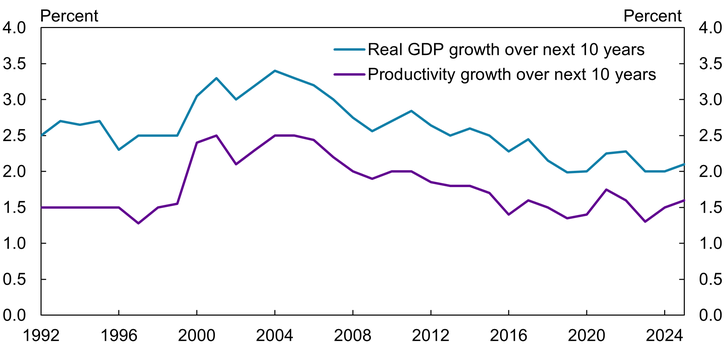
Source: Survey of Professional Forecasters (Haver Analytics).
Shifts in the supply and demand of safe government debt can provide another explanation for the apparent reversal of the decades-long decline in real interest rates. The supply of marketable U.S. debt securities increased from roughly $17 trillion in 2019 to $28 trillion by the end of 2024. At the same time, foreign official demand for U.S. government debt has waned. As discussed in Section I, foreign governments have been large buyers of government debt in the past. Savings flowing in from abroad can blunt the effect of increases in government debt on interest rates. However, Chart 8 shows that foreign official buying of U.S. government debt has not kept pace with issuance, driving down the share of foreign official holdings of U.S. government debt from a peak of roughly 40 percent in 2009 to about 12 percent in early 2025.
Chart 8: Foreign Official Buying of U.S. Government Debt Has Not Kept Pace with Issuance
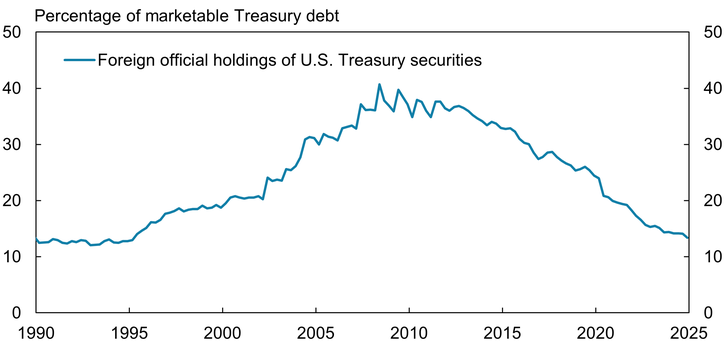
Sources: U.S. Treasury (Haver Analytics) and authors’ calculations.
Regulatory demand has also failed to keep pace with the post-2019 increase in the supply of government debt. After 2008, changes in regulations required that banks and money funds firms hold more safe, liquid assets to enhance their resiliency, increasing the demand for Treasury debt. After the pandemic, however, there was not a similarly large increase in regulatory demand for U.S. government debt. Although recently discussed changes to the treatment of Treasuries in banks’ required capital ratios as well as emerging regulations on crypto assets could boost demand for U.S. government debt, the extent of the increase has yet to match the large increase in supply. The source of demand for U.S. government debt is important for interest rates because foreign official and regulatory demand stems from the safety and liquidity of Treasuries, whereas other buyers are more interest-rate sensitive. Chart 9 accounts for both foreign and regulatory demand for U.S. government debt (shown on an inverted axis) and illustrates that the net supply of safe government debt—total government debt less foreign official and regulatory demand (the solid black line)—has increased significantly since 2019.
Chart 9: Net Supply of Safe Assets Has Increased by a Large Amount Since 2019
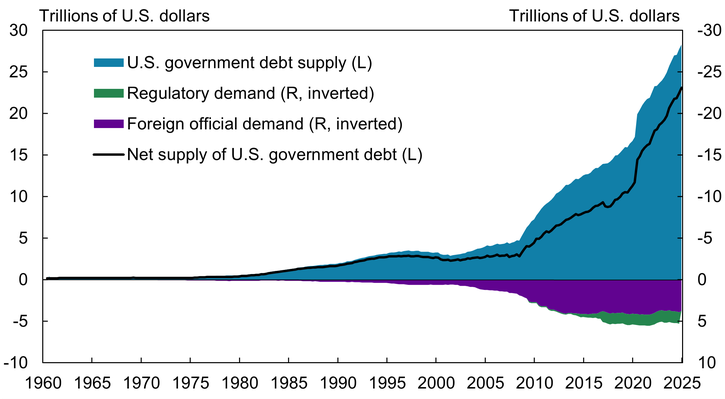
Note: Net supply of U.S. government debt equals U.S. government debt supply less regulatory and foreign official demand.
Sources: U.S. Department of the Treasury, Board of Governors of the Federal Reserve System, and Investment Company Institute (all accessed via Haver Analytics), and authors’ calculations based on Ferreira and Shousha (2023).
These shifts in supply and demand for government debt are likely to prove persistent. In terms of supply, the Congressional Budget Office (CBO) projects that the stock of government debt will continue to increase into the future. Chart 10 shows that as of mid-2024, the CBO projected a permanently higher path for the debt-to-GDP ratio relative to projections made before the pandemic. On the demand side, neither foreign demand nor regulatory demand appears likely to keep pace with the large growth in supply (Dilts Stedman 2025; Sengupta and Jacobs 2025).
Chart 10: Projections for Federal Debt-to-GDP Are on a Higher Trajectory Post-Pandemic
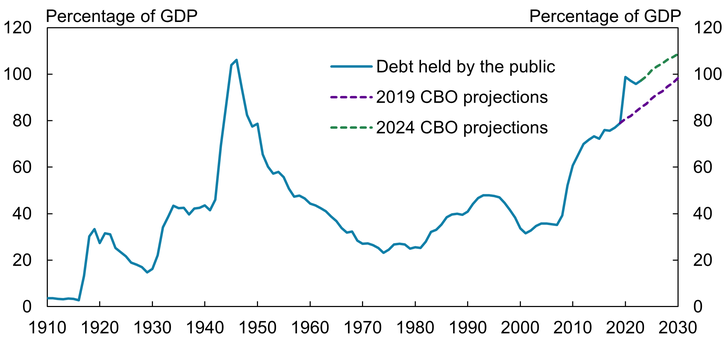
Source: Congressional Budget Office.
Whether this shifting supply-demand balance for government debt is large enough to explain the apparent increase in the normal level of interest rates post-pandemic is an open question. To address this question and quantify the effects of a persistent increase in the supply of safe assets on interest rates, we estimate a statistical model on the net supply of government debt, interest rates, and inflation, from 1960 through 2024. We measure the net supply of safe government debt as in Ferreira and Shousha (2023) by taking the total supply of marketable Treasury debt less foreign official demand and regulatory demand (each of which are shown in Chart 9)._
Debt and interest rates can shift temporarily for cyclical reasons, such as a recession; however, we aim to study the consequences of a long-lasting increase in government debt relative to demand. As a result, we attempt to isolate from the data movements in the net supply of government debt that explain most of the variation in this variable over a 10-year horizon._ By focusing on such a long horizon, we are aiming to remove variation in net debt supply driven by transitory increases and instead focus on persistent or more lasting increases. Another appealing aspect of this approach is that it conceptually captures the consequences of not just realized increases but also news of expected future increases in the net supply of government debt that materialize over years to come, which may be relevant for capturing the post-2019 shift in government debt projections. As discussed in Section I, economic theory suggests that a lasting increase in the net supply of government debt should raise interest rates, as the supply of safe assets increases and draws down excess savings. However, our statistical model can help quantify this effect based on historical patterns in the data._
Chart 11 shows the time paths for inflation and short-term and long-term interest rates over the next 10 years following a one standard deviation increase in the net supply of government debt. According to this statistical model, a persistent increase in the net supply of U.S. government debt leads to persistent increases in interest rates and inflation in subsequent quarters, consistent with economic theory. Long-term rates (as measured by the 10-year Treasury yield) rise by about as much as the short-term federal funds rate, indicating that the level of the yield curve shifts higher._ The initial rise in inflation outpaces the increase in the federal funds rate for the first several quarters, leading the real funds rate—that is, the funds rate less expected inflation—to initially decline._ However, as the funds rate moves higher to contain inflation, the real federal funds rate turns positive in later quarters and remains elevated.
Chart 11: Estimated Response to a Persistent Increase in the Net Supply of U.S. Government Debt
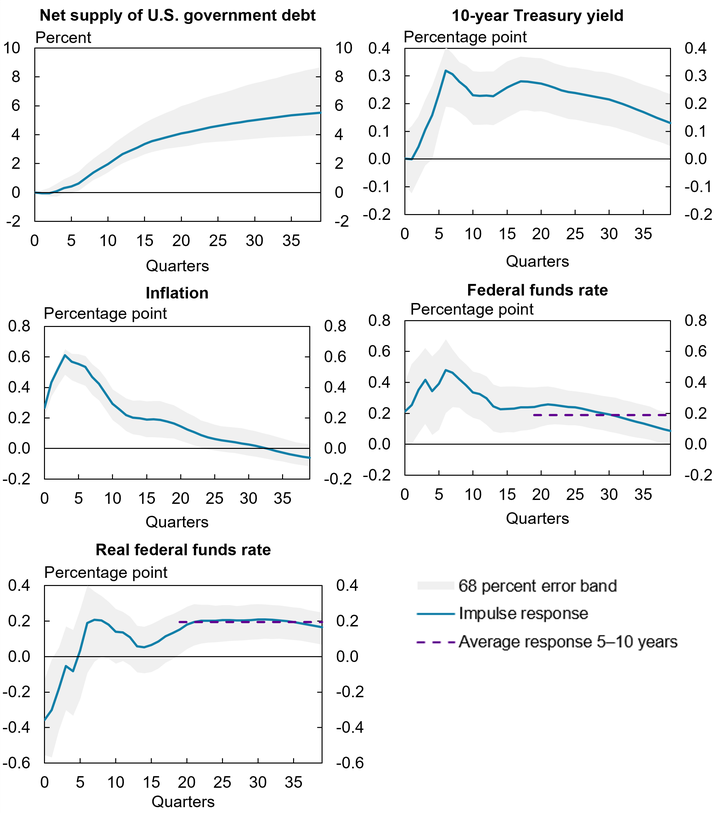
Sources: U.S. Department of the Treasury, Investment Company Institute, U.S. Bureau of Economic Analysis, and Board of Governors of the Federal Reserve System (all accessed via Haver Analytics); Ferreira and Shousha (2023) and authors’ calculations.
In terms of magnitude, the model indicates that a 5 percent increase in the net supply of government debt has historically resulted in a roughly 15–20 basis-point increase in real short-term interest rates over the following five to 10 years (as shown by the dashed purple line)._ Based on the pre-pandemic growth rate in government debt, the net supply of safe assets is 30 to 40 percent higher than would have been expected in 2019 given historical growth in Treasury supply. Therefore, the estimates in Chart 11 imply that real short-term interest rates five to 10 years in the future may by as much as 120 to 160 basis points higher than pre-pandemic._ Recall that estimates of the longer-run normal funds rate have increased by 100–200 basis points or so, depending on the measure. In other words, shifts in the supply and demand for safe assets can potentially explain much of the post-pandemic rise in estimates of the longer-run normal level of interest rates.
Conclusion
The longer-run normal level of U.S. interest rates is believed to have declined in prior decades, leading to prolonged spells of near-zero policy rates. While many factors determine the normal level of interest rates, a shortage of safe assets after the GFC appears to have contributed to this decline. More recently, the relative supply and demand for safe assets has shifted in ways that could leave interest rates higher in the future. Should these shifts persist, monetary policymakers may have more room to reduce the federal funds rate in a downturn, leading to fewer or more fleeting encounters with the zero lower bound. Given the imprint that the risk of the zero lower bound has left on monetary policy in recent decades, a lasting reduction in this risk could have important consequences for monetary policy in the years ahead.
While this article has focused on the U.S. experience, other countries have experienced similar dynamics in recent decades: years of declining longer-term real interest rates followed by higher government debt levels and higher interest rates post-2019. Generally, across advanced economies, market-implied rate expectations and forecasts indicate that central bank policy rates are not expected to return to the very low levels that prevailed just before the pandemic. Further analysis of the relationship between debt and interest rates in other countries could be valuable as economists and policymakers continue to assess shifts in the economy since the pandemic.
Endnotes
-
1 Our terminology of the longer-run normal level of the funds rate follows the description in the FOMC’s quarterly Summary of Economic Projections (SEP). The SEP describes the longer-run federal funds rate as the value to which the federal funds rate would be expected to converge under appropriate monetary policy and in the absence of further shocks to the economy. This notion of the longer-run normal federal funds rate is closely related to the neutral level of the federal funds rate, which is neither expansionary nor restrictive.
-
2 At the FOMC meeting on June 24–25, 2003, the Board staff also presented potential options for the FOMC to ease monetary policy further without adjusting the current federal funds rate, including forward guidance and balance sheet adjustments—an early precursor to actions the Committee would deploy during the GFC and the COVID-19 pandemic.
-
3 Mertens and Williams (2021) more directly show that the decline in the neutral level of interest rates led to an increase in zero lower bound risk before the pandemic.
-
4 For example, in the scarce-reserves operating framework used prior to 2009, past asset purchases would need to be fully unwound before increasing the federal funds rate.
-
5 The methodology builds on Swanson (2006). We are grateful to Eric Swanson for sharing his code.
-
6 Cho, Mertens, and Williams (2025) use alternative interest-rate derivatives but similarly find the zero lower bound risk has diminished at all horizons compared with just before the pandemic. Nevertheless, they note that at medium-term horizons, the zero lower bound remains a risk owing to greater uncertainty about interest rate outcomes. Our data on SOFR interest-rate options at longer horizons have insufficient trading volumes and liquidity to reliably calculate the implied probability of the zero lower bound over this long period. The External LinkFederal Reserve Bank of San Francisco provides market-based measures of interest-rate probability distributions at longer horizons based on alternative interest-rate derivatives known as caps and floors.
-
7 Inflation is measured using the year-over-year percent change in the GDP deflator.
-
8 Our empirical approach is based on Barsky and Sims (2011).
-
9 Gust and Skaperdas (2024) provide a useful summary of empirical estimates of the effects of government debt on U.S. interest rates. As they highlight, few papers distinguish between effects in longer-run normal interest rates (r*) or term-premiums. We try to disentangle these two channels by studying the response of both short-term and long-term interest rates over 10 years.
-
10 This result suggests that the term premium, the extra return investors require to hold a long-term Treasury security, initially increases.
-
11 We proxy expected inflation in our statistical model by the path of inflation predicted by the model one year ahead (specifically, the four-quarter-ahead inflation impulse response).
-
12 Our estimates imply that a 1 percentage point increase in the net supply of government debt leads to a 3.5 basis point increase in the average real federal funds rate five to 10 years ahead. Our estimates imply that the nominal funds rate increases by a similar amount over the following five to 10 years. Although the precise scaling differs, these estimates appear to be within the range of prior studies, including those of Engen and Hubbard (2004), Laubach (2009), and Gruber and Kamin (2012).
-
13 The shaded regions in Chart 11 underscore the considerable uncertainty that accompanies these empirical estimates of the longer-run effects of government debt on short-term interest rates. This uncertainty is further magnified by scaling the typical increase in expected government debt historically observed by the magnitude of the rise witnessed since 2019. There is further uncertainty in extrapolating these historical estimates to recent developments. For example, whether interest rates respond the same to such a large increase over a short period of time is unknown.
Article Citation
Smith, A. Lee, and Brent Bundick. 2025. "Reassessing Zero Lower Bound Risk: Safe Assets and Interest Rates Post-Pandemic." Federal Reserve Bank of Kansas City, Economic Review, vol. 110, no. 5. Available at https://doi.org/10.18651/ ER/v110n5BundickSmith
Publication information: Vol. 110, no. 5
DOI: 10.18651/ER/v110n5BundickSmith
References
Barsky, Robert, and Matthew Easton. 2021. “The Global Saving Glut and the Fall in U.S. Real Interest Rates: A 15-Year Retrospective.” Federal Reserve Bank of Chicago, Economic Perspectives, no. 2021-1. Available at External Linkhttps://doi.org/10.21033/ep-2021-1
Barsky, Robert B., and Eric R. Sims. 2011. “News Shocks and Business Cycles.” Journal of Monetary Economics, vol. 58, no. 3, pp. 273–289. Available at External Linkhttps://doi.org/10.1016/j.jmoneco.2011.03.001
Bernanke, Ben S. 2005. “The Global Saving Glut and the U.S. Current Account Deficit.” Remarks at the Sandridge Lecture, Virginia Association of Economists, Richmond, VA, March 10.
Bernanke, Ben S., Carol Bertaut, Laurie Pounder DeMarco, and Steven Kamin. 2011. “International Capital Flows and the Returns to Safe Assets in the United States, 2003–2007.” Board of Governors of the Federal Reserve System, International Finance Discussion Papers no. 1014, February. Available at External Linkhttps://doi.org/10.17016/ifdp.2010.1014
Board of Governors of the Federal Reserve System. 2003. “Transcript of the Meeting of the Federal Open Market Committee June 24–25, 2003.”
Bundick, Brent, Logan Hotz, and A. Lee Smith. 2025. “How Optimal Was U.S. Monetary Policy at the Zero Lower Bound?” Journal of Financial Econometrics, vol. 23, no. 2. Available at External Linkhttps://doi.org/10.1093/jjfinec/nbaf001
Çakır Melek, Nida, and Alex Gallin. 2024. “The Future of U.S. Productivity: Cautious Optimism amid Uncertainty” Federal Reserve Bank of Kansas City, Economic Review, vol. 9, no. 9. Available at External Linkhttps://doi.org/10.18651/ER/v109n9CakirMelekGallin
Cho, Sophia, Thomas Mertens, and John C. Williams. 2025. “The Zero Lower Bound Remains a Medium-Term Risk.” Federal Reserve Bank of San Francisco, Economic Letter, no. 2025-16, July 7.
De Nardi, Mariacristina, Eric French, John Bailey Jones, Rory McGee, and Tim Sablik. 2021. “Why Do People Save During Retirement?” Federal Reserve Bank of Richmond, Economic Brief, no. 21-32, September.
Dilts Stedman, Karlye. 2025. “The Changing Investor Composition of U.S. Treasuries, Part 1: Foreign Treasury Sales Could Raise U.S. Yields.” Federal Reserve Bank of Kansas City, Economic Bulletin, July 9.
Engen, Eric M., and R. Glenn Hubbard. 2004. “Federal Government Debt and Interest Rates,” in Mark Gertler and Kenneth Rogoff, eds., NBER Macroeconomics Annual, vol. 19, pp. 83–138, MIT Press. Available at External Linkhttps://doi.org/10.1086/ma.19.3585331
Fernald, John G., and Bing Wang. 2015. “The Recent Rise and Fall of Rapid Productivity Growth.” Federal Reserve Bank of San Francisco, Economic Letter, no. 2014-04, February 9.
Ferreira, Thiago R. T., and Samer Shousha. 2023. “Determinants of Global Neutral Interest Rates.” Journal of International Economics, vol. 145. Available at External Linkhttps://doi.org/10.1016/j.jinteco.2023.103833
Gruber, Joseph W., and Steven B. Kamin. 2012. “Fiscal Positions and Government Bond Yields in OECD Countries.” Journal of Money, Credit, and Banking, vol. 44, no. 8, pp. 1563–1587. Available at External Linkhttps://doi.org/10.1111/j.1538-4616.2012.00544.x
Gust, Christopher, and Arsenios Skaperdas. 2024. “Government Debt, Limited Foresight, and Longer-Term Interest Rates.” Board of Governors of the Federal Reserve System, Finance and Economics Discussion Series (FEDS), no. 2024-027, May. Available at External Linkhttps://doi.org/10.17016/FEDS.2024.027
Laubach, Thomas. 2009. “New Evidence on the Interest Rate Effects of Budget Deficits and Debt.” Journal of the European Economic Association, vol. 7, no. 4, pp. 858–885. Available at External Linkhttp://www.jstor.org/stable/40282791
Mertens, Thomas M., and John C. Williams. 2021. “What to Expect from the Lower Bound on Interest Rates: Evidence from Derivatives Prices.” American Economic Review, vol. 111, no. 8, pp. 2473–2505. Available at External Linkhttps://doi.org/10.1257/aer.20181461
Sengupta, Rajdeep, and Joshua A. Jacobs. 2025. “The Changing Investor Composition of U.S. Treasuries, Part 2: Who’s Buying U.S. Treasuries?” Federal Reserve Bank of Kansas City, Economic Bulletin, July 9.
Swanson, Eric T. 2006. “Have Increases in Federal Reserve Transparency Improved Private Sector Interest Rate Forecasts?” Journal of Money, Credit, and Banking, vol. 38, no. 3, pp. 791–819.
Yellen, Janet L. 2015. “Normalizing Monetary Policy: Prospects and Perspectives.” Remarks at “The New Normal Monetary Policy” conference sponsored by the Federal Reserve Bank of San Francisco, San Francisco, California, March 27.
A. Lee Smith is a senior vice president and economist at the Federal Reserve Bank of Kansas City. Brent Bundick is a vice president and economist at the bank. The views expressed are those of the authors and do not necessarily reflect the positions of the Federal Reserve Bank of Kansas City or the Federal Reserve System.
Authors

A. Lee Smith
Senior Vice President