Energy commodity prices have been on an upward trend since early 2016. Prices climbed especially in the second half of 2017: the spot energy index, a commonly used measure of energy prices from Standard and Poor’s Goldman Sachs Commodity Index, rose about 30 percent. The recovery in prices helped reverse a decline in U.S. energy production. After dropping slightly in 2016, annual U.S. energy production is estimated to have reached a record high level in 2017 (Chart 1).
Chart 1: U.S. Energy Production
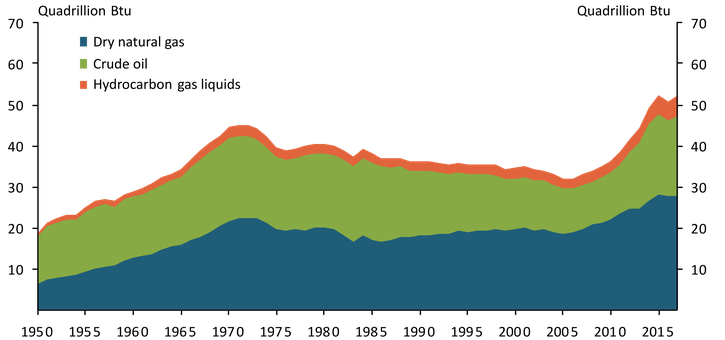
Sources: Energy Information Administration (EIA) and authors' calculations.
High production levels can be attributed to increased crude oil and natural gas production. Higher oil prices prompted a rebound in drilling activity: oil production started to rise in late 2016 and accelerated in late 2017. In November 2017, U.S. crude oil production reached 10.038 million barrels per day (mbpd), fractionally below the previous record of 10.044 mbpd set in November 1970. This resurgence has brought the level of U.S. production in line with Saudi Arabia and closer to Russia, the world’s largest oil producer.
The boom in U.S. oil production over the past decade, driven mainly by tight oil production, has been a remarkable turning point for U.S. trade flows._ Although the United States is still a net oil importer, its net imports have fallen sharply. Chart 2 shows that imports of crude oil dropped from 10.8 mbpd in mid-2005 to 7.8 mbpd by the end of 2017. Net imports of crude oil fell by more than 4 mpbd, as the United States sold increasing volumes of oil around the world during this period. After the removal of the crude oil export ban in December 2015, U.S. exports grew continually, rising from an average of 0.59 mpbd in 2016 to an average of 1.5 mbpd in the last quarter of 2017._ Rising domestic production and favorable oil price spreads also contributed to the upward trend in crude oil exports.
Chart 2: U.S. Crude Oil Trade
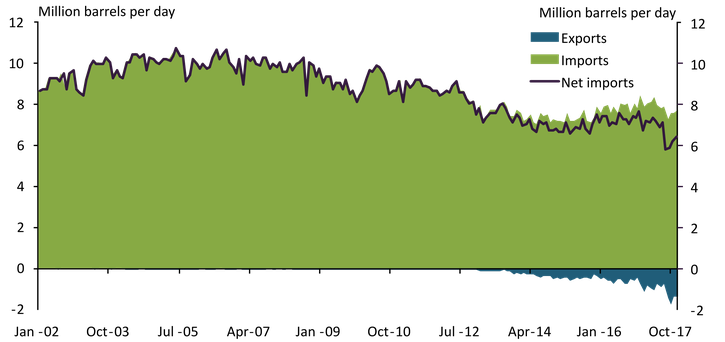
Source: EIA.
At the same time, increasing domestic production of natural gas from shale gas and tight oil formations has helped improve natural gas trade flows, too. Declining natural gas imports, increasing natural gas pipeline exports, and higher exports of liquefied natural gas have supported this trend. Chart 3 shows exports and imports of natural gas over the past 15 years. In 2017, the United States became a net exporter of natural gas for the first time since 1957 (Energy Information Administration [EIA]).
Chart 3: U.S. Natural Gas Trade
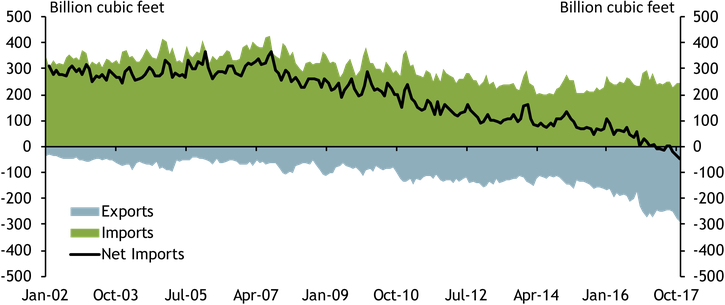
Source: EIA.
In addition, the United States has been a net exporter of petroleum products, such as gasoline and diesel, since 2011. Exports of petroleum products have continued to increase over time, rising from 4.7 mbpd in 2016 to an estimated 5.1 mbpd in 2017. As imports of petroleum products have been relatively stable, increasing exports have translated into continued improvement in the U.S. petroleum products trade.
These developments in petroleum and natural gas markets have led U.S. net energy imports to decline substantially. Chart 4 shows that net energy imports declined from 28.4 quadrillion Btu in the second half of 2006 to 5.6 quadrillion Btu by the end of 2017. This trend was driven by the petroleum trade (crude oil, petroleum products, and hydrocarbon gas liquids) in general and by crude oil in particular: in energy-equivalent terms, the natural gas trade constitutes only a small portion of energy trade flows. After being interrupted from mid-2014 to late 2016, due in part to the collapse of energy prices, U.S. net energy imports have resumed their declining trend since late 2016._
Chart 4: U.S. Energy Trade
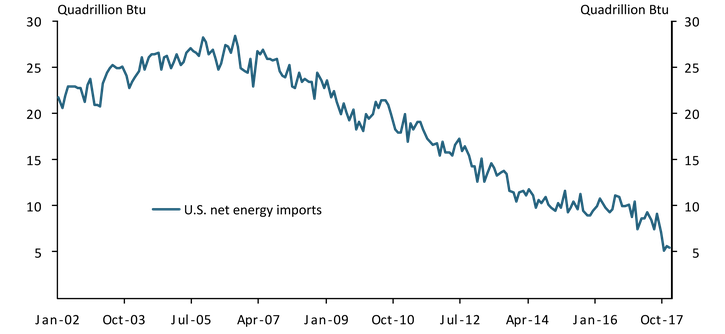
Sources: EIA and authors' calculations.
The decline in U.S. net energy imports has prevented the total U.S. trade deficit from widening further. Chart 5 shows that petroleum has been an increasingly important component of U.S. goods trade. In 2006, petroleum accounted for about 16 percent of U.S. goods imports and about 3 percent of U.S. goods exports. By the end of 2017, the share of petroleum in total goods imports declined to 8 percent, while the share in total goods exports almost tripled, shrinking the U.S. petroleum trade deficit. Had the petroleum trade deficit not improved, all else unchanged, the total U.S. trade deficit would likely have been more than 35 percent wider by the end of 2017.
Chart 5: U.S. Trade in Goods and Petroleum
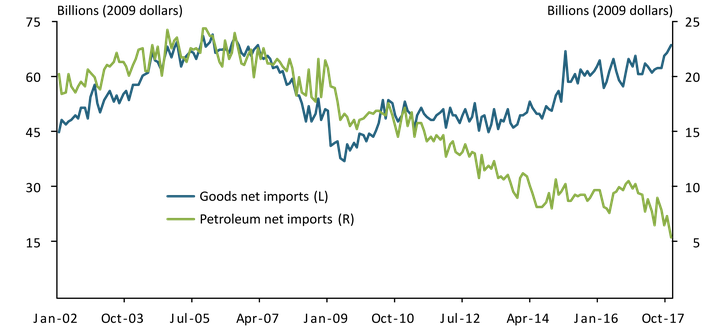
Source: U.S. Census Bureau (Haver Analytics).
Several factors suggest the trend in U.S. petroleum trade will likely continue. In recent months, West Texas Intermediate oil prices have climbed higher. The number of active oil rigs has also started to increase again, which could help boost U.S. oil production throughout 2018. Moreover, the more positive global economic outlook for 2018—as published, for example, by the International Monetary Fund—suggests higher global oil demand growth, which would likely support prices and trade. In addition, the International Energy Agency (IEA) and EIA expect most growth in the global oil supply to come from the United States, which could lower domestic prices relative to international prices. A more favorable oil price spread could, in turn, boost domestic exports. Together, these developments suggest the U.S. petroleum trade could continue to help narrow the U.S. trade deficit in 2018.
To examine what continuing declines in petroleum net imports would mean for the U.S. trade balance in 2018, we use simple statistical models and provide estimates for U.S. net petroleum imports. To better capture petroleum net imports’ recent trend, we estimate our statistical models using data since November 2016. We consider two models—a linear-trend model, which best captures the long-run trend of net imports, and an optimal autoregressive (AR) model, which captures more variations in recent months. The linear-trend model predicts that U.S. net petroleum imports will decline by $3.8 billion (in 2009 dollars) in 2018 (Chart 6, blue dotted line). An optimal AR model (estimated with three lags), on the other hand, suggests U.S. net petroleum imports will decline by about $1 billion (in 2009 dollars) from the end of 2017 to the end of 2018 (green dotted line).
Chart 6: U.S. Petroleum Trade Deficit Forecasts
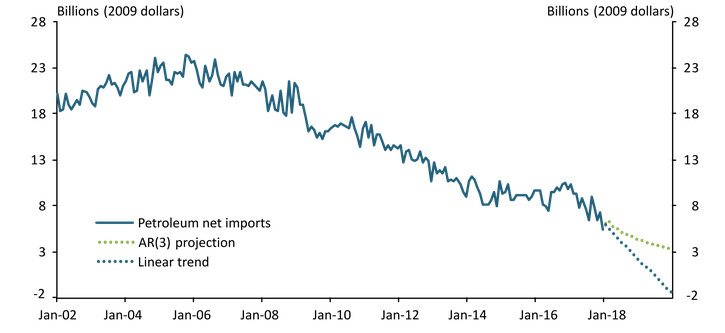
Sources: U.S. Census Bureau (Haver Analytics) and authors' calculations.
The average of these two projections suggests petroleum net imports will decline by $2.4 billion from the end of 2017 to the end of 2018, equivalent to about 5 percent of the U.S. trade deficit in December 2017. In other words, if the petroleum trade deficit continues to shrink, it could help narrow the U.S. trade deficit by about 5 percent by the end of 2018, assuming other components stay the same.
Endnotes
-
1 Çakır Melek, Plante, and Yucel (2017) find that the U.S. shale oil boom improved the petroleum trade balance significantly and boosted U.S. GDP by more than 1.4 percent from 2010 to 2015.
-
2 For a more detailed discussion of the export ban and potential gains from its removal, see Çakır Melek and Ojeda (2017).
-
3 Oil prices collapsed in mid-2014, due in part to shifts in expectations of future availability of supply relative to demand (Davig and others 2015).
References
Çakır Melek, Nida, and Elena Ojeda. 2017. “Lifting the U.S. Crude Oil Export Ban: Prospects for Increasing Oil Market Efficiency.” Federal Reserve Bank of Kansas City, Economic Review, vol. 102, no. 2, pp. 51–74.
Çakır Melek, Nida, Michael Plante, and Mine K. Yucel. 2017. “The U.S. Shale Oil Boom, the Oil Export Ban, and the Economy: A General Equilibrium Analysis.” Federal Reserve Bank of Kansas City, Research Working Paper No. 17-10, September. Available at External Linkhttps://doi.org/10.18651/RWP2017-10
Davig, Troy A., Nida Çakır Melek, Jun Nie, Didem Tüzemen, and A. Lee Smith. 2015. “Evaluating a Year of Oil Price Volatility.” Federal Reserve Bank of Kansas City, Economic Review, vol. 100, no. 3, pp. 5–30.
Nida Çakır Melek is an economist at the Federal Reserve Bank of Kansas City. Jun Nie is a senior economist at the bank. The views expressed are those of the authors and do not necessarily reflect the positions of the Federal Reserve Bank of Kansas City or the Federal Reserve System.
Author