Throughout 2015, residential investment grew at more than a 10 percent annual rate. This trend changed in 2016, as residential investment modestly decelerated in the first quarter, plunged in the second quarter, and is likely to have contracted again in the third quarter. Despite this reversal, rising house prices and rents suggest demand for housing remains strong. Instead, residential investment now appears to be constrained by supply-side factors, a situation that may persist for a considerable time.
Looking separately at the four main components of residential investment helps explain this weakening trend. Single-family construction, which accounted for 36 percent of nominal residential investment in 2015, made a significant positive contribution in most quarters from 2013:Q1 to 2015:Q4 (Chart 1). While the Bureau of Economic Analysis originally reported that single-family construction also made a large positive contribution in the first quarter of 2016, the annual revisions incorporated in the second quarter release showed that single-family construction had actually contracted moderately, thereby making a negative contribution. The contraction accelerated in the second quarter, resulting in a significantly more negative contribution to residential investment.
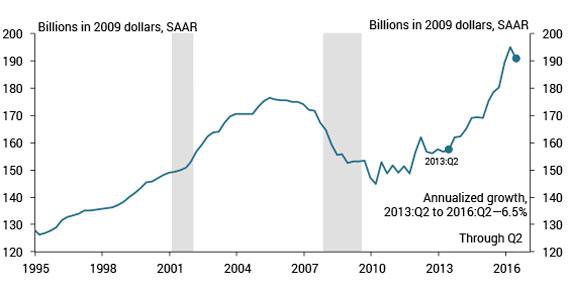
Chart 1: Contributions to residential investment
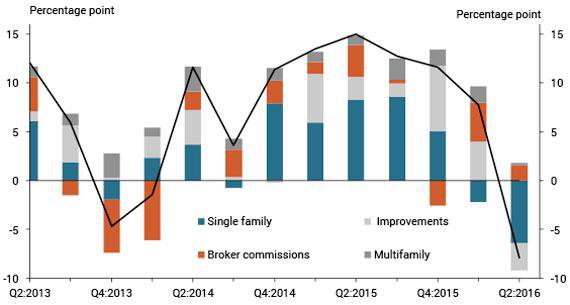
Note: Black line shows the quarterly change in residential investment (real, SAAR).
Sources: Bureau of Economic Analysis and Haver Analytics.
Residential improvements, which accounted for 32 percent of residential investment, and multifamily construction, which accounted for 8 percent of residential investment, made significant positive contributions in most quarters from 2013:Q1 to 2016:Q1. But improvements contracted significantly in the second quarter of 2016, making a large negative contribution to residential investment. Multifamily construction was flat in the second quarter, making no contribution.
Brokers’ commissions, which accounted for 22 percent of residential investment, are the most volatile component of residential investment, making significant positive contributions in some quarters and significant negative contributions in others. In the second quarter of 2016, they made a moderate positive contribution, partly offsetting the weakness from the contractions in single-family construction and improvements.
Looking forward, single-family construction is likely to continue to drag down residential investment. Single-family housing starts peaked in March 2016 and have since sharply declined (Chart 2, orange line). As building a single-family home typically takes about six months, the recent decline in starts will put downward pressure on single-family construction during the third and fourth quarters. Moreover, single-family permits (blue line), a more forward-looking and better-measured indicator of construction, have been running considerably below starts, suggesting that single-family construction will remain weak in 2017.
Chart 2: Single-family starts and permits
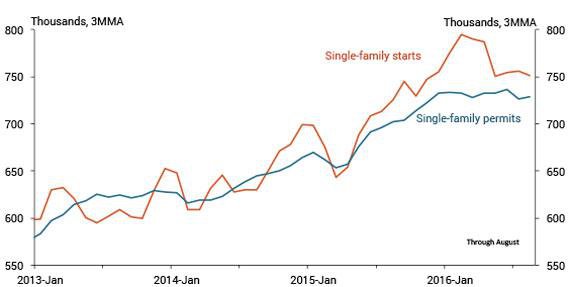
Sources: Census Bureau and Haver Analytics.
The longer-term outlook for single-family construction depends on the factors constraining it. Numerous anecdotes suggest that the main constraint is a limited supply of undeveloped land in desirable locations. In particular, suburbanization may have reached its geographic limit in many metro areas. If this is correct, single-family homes will increasingly be constructed closer to the center of metros rather than in new subdivisions at the periphery. Such infill construction faces considerable challenges, including land-use restrictions, dispersed locations, and the expense of tearing down existing homes..
Multifamily construction is unlikely to contribute much to residential investment during the remainder of 2016. Multifamily housing starts peaked in mid-2015 and then moved down through the first part of 2016 (Chart 3, orange line). While starts have since picked up, multifamily permits (blue line) moved steadily down through the summer, suggesting some downside risk.
Chart 3: Multifamily starts and permits
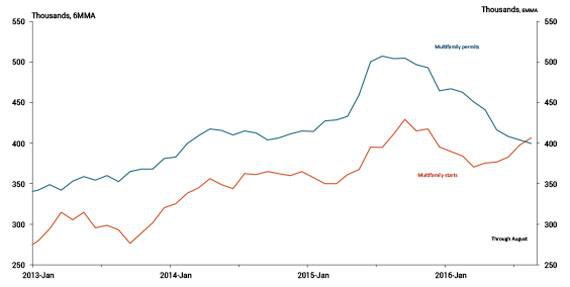
Sources: Census Bureau and Haver Analytics.
Multifamily construction is likely to firm in 2017, but growth will be less vigorous than during the past few years. The rebound in multifamily construction after the most recent recession was driven primarily by young adults—people in their twenties and early thirties—swinging back toward living in multifamily units following a swing toward single-family homes during the housing boom (Rappaport). This swing back has now largely played out. But recent income and employment gains are increasing demand by individuals living with family or roommates to move out on their own, supporting continuing firm multifamily construction. In addition, college-educated young adults appear to increasingly favor living near urban centers, also supporting continuing firm multifamily construction (Couture and Handbury).
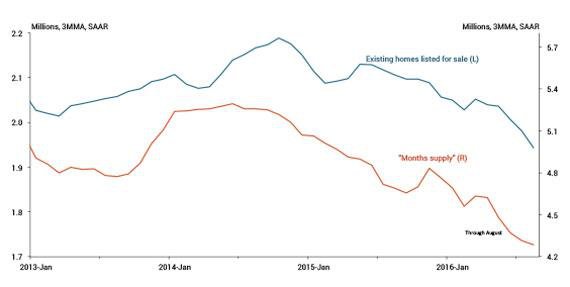
Brokers’ commissions are also unlikely to contribute much to residential investment during the remainder of 2016. The number of existing homes listed for sale and the ratio of listed homes to monthly sales (“months supply”) are extremely low, having moved significantly down since late 2014 (Chart 4). This tight supply is constraining home sales and hence brokers’ commissions.
Chart 4: Sales listings
Note: Chart shows the increase in the shelter component of the CPI from 2015:H1 to 2016:H1. Orange bars indicate metros located in the West Census Region. The chart includes the 21 metros for which the BLS reports price indices that have at least 1 percent weight in aggregate CPI. Monthly data through November, available for a subset of metros, shows rent inflation recently picked up in Dallas and decelerated in Houston.
Source: Bureau of Labor Statistics (Haver Analytics).
The tight supply of homes available for sale is likely to persist for the foreseeable future. Many households considering selling their current home are being discouraged from doing so by the challenge they would face finding an alternative home to move into. This self-reinforcement may be why significant increases in home prices over the past few years have not elicited more sales listings.
More optimistically, residential improvements are likely to resume increasing by early 2017. Their contraction in the second quarter of 2016 followed three years of strong upward movement, including sharp increases in the previous two quarters (Chart 5).
Chart 5: Residential improvements
Sources: Bureau of Economic Analysis and Haver Analytics.
Consistent with this upward momentum, the supply constraints dampening single-family construction and sales listings are likely to channel continuing strong housing demand into residential improvements. With limited single-family construction and few sales listings, many households may choose to remodel their current home rather than upgrade to a different one. Other households may purchase existing homes in greater need of renovation than in the past, when listings were more plentiful.
Improvements account for almost one third of residential investment, giving them the potential to compensate for much of the weakness in construction and brokers’ commissions. However, the extent to which they are able to do so will not be immediately clear, as improvements are poorly measured and subject to large annual revisions. Regardless, the composition of residential investment going forward is likely to significantly differ from its composition over the past few years.
References
Rappaport, Jordan. 2015. "Millennials, Baby Boomers, and Rebounding Multifamily Home Construction." Federal Reserve Bank of Kansas City, Economic Review, vol. 100, no. 2, pp. 37–55.
Couture, Victor, and Jessie Handbury. "Urban Revival in America, 2000 to 2010." Working Paper, University of Pennsylvania.
Jordan Rappaport is a senior economist at the Federal Reserve Bank of Kansas City. Maeve Maloney, a research associate at the bank, helped prepare the article. The views expressed are those of the author and do not necessarily reflect the positions of the Federal Reserve Bank of Kansas City or the Federal Reserve System.
Author
