Growth in average hourly earnings (AHE) of all employees has accelerated gradually over the past two years despite a marked slowdown in January 2017. Chart 1 shows growth in AHE in the nonfarm private sector fluctuated around an average of 2.0 percent from 2011 to 2014. In 2015, however, wage growth began to pick up. AHE growth increased from 1.9 percent in December 2014 to 2.8 percent in December 2016. Although wage growth fell back to 2.5 percent in January, it remains 0.6 percentage point higher than in December 2014.
Chart 1: Average hourly earnings, all employees, nonfarm private sector
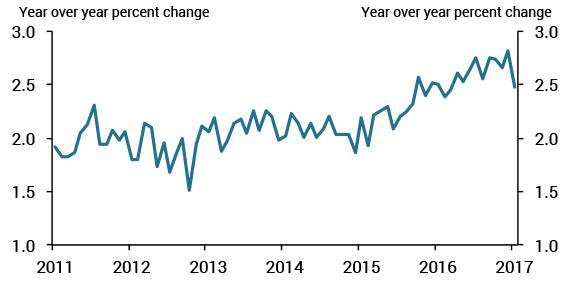
Source: Bureau of Labor Statistics (Haver Analytics).
I decompose the recent 0.6 percentage point acceleration in wage growth into the contributions from each industry as well as the contribution from shifts in economic activity between industries._ When the number of hours worked shifts from a low-wage industry to a high-wage industry, for instance, the overall wage level rises even if the wages in both industries remain constant. This “between-industry” wage growth is typically small: indeed, it contributed just 0.1 percentage point to the recent acceleration in AHE. The remaining 0.5 percentage point of the acceleration can be attributed to wage growth within individual industries. The contributions to this “within-industry” wage growth consist of each industry’s wage growth weighted by its share of total hours worked, so large industries will more easily contribute to overall wage growth than small ones.
Table 1 displays the share of hours worked in each nonfarm, private-sector industry alongside its contribution to the increase in within-industry wage growth. The table divides industries into one of three groups: wage leaders, wage laggards, and other industries. Wage leaders—the manufacturing, construction, and wholesale trade industries—made outsized contributions to the acceleration of AHE. Although their contributions are not necessarily the largest, they are impressive considering these industries’ medium size. As a group, wage leaders made up less than a quarter of total hours worked but contributed 0.4 of the 0.5 percentage point increase. In contrast, wage laggards made modest contributions considering their size, or even negative ones. For example, the education and health-care industry contributed about 0.1 percentage point to the acceleration, a small contribution given the industry’s large share of hours worked. As a group, wage laggards accounted for almost two-thirds of hours worked but subtracted almost 0.1 percentage point from the acceleration in AHE. Finally, the five remaining industries in the “other” group were too small to make significant contributions. Together, they made up 12.5 percent of hours worked and accounted for less than 0.2 percentage point of the wage acceleration._
Table 1: Increase in within-industry wage growth, December 2014–January 2017
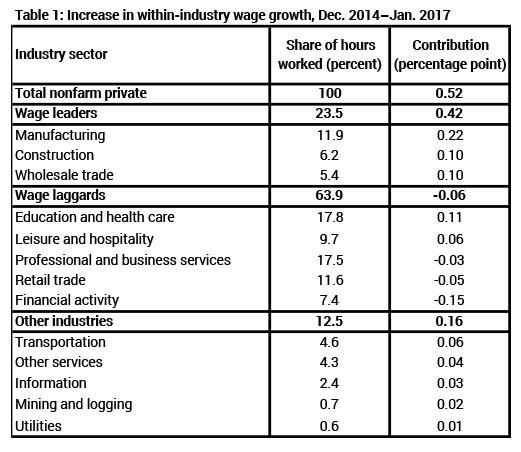
Sources: Bureau of Labor Statistics (Haver Analytics) and author’s calculations.
Though only a few industries accounted for much of the recent acceleration in AHE, it may yet be sustainable. Chart 2 shows the growth in hours worked for both wage leaders and wage laggards. From 2011 to 2014, the two groups experienced similar growth in hours worked. However, over the past two years, wage laggards have seen faster growth in hours worked. The relatively strong growth in hours worked suggests labor demand in the wage laggard industries continues to rise at a brisk pace. As labor demand rises nearer to labor-supply constraints, wages in these industries may soon begin accelerating. Thus, Chart 2 supports a forecast of a continued rise in overall wage growth based on the combination of rising wage growth for the wage laggards and steady (or rising) wage growth for the wage leaders. The bottom-up approach taken here complements the macroeconomic Phillips-curve approach relating higher wage growth to declining labor market slack. Reassuringly, as the latest Blue Chip consensus forecast calls for continued declines in the unemployment rate, both approaches predict a further increase in wage growth: one based on the wage laggards’ relatively strong growth in hours worked, the other based on a projected decline in overall labor market slack.
Chart 2: Hours worked
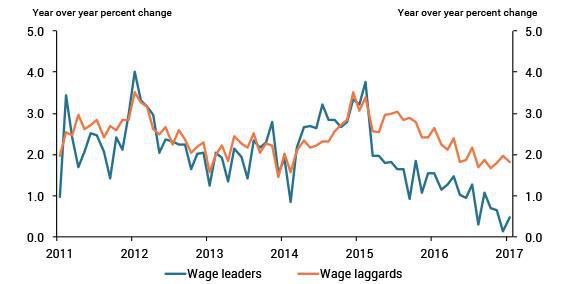
Source: Bureau of Labor Statistics (Haver Analytics).
To view footnotes for this article navigate to pages 2-3 in this PDF.
Willem Van Zandweghe is an assistant vice president and economist at the Federal Reserve Bank of Kansas City. The views expressed are those of the author and do not necessarily reflect the positions of the Federal Reserve Bank of Kansas City or the Federal Reserve System.