The unemployment rate has declined dramatically since 2009 and currently stands at 4.1 percent, its lowest rate since 2000. For policymakers, the unemployment rate is an important indicator of the health of the labor market; where the unemployment rate stands in relation to its trend rate is also informative. The low unemployment rate over the past few years has increased interest in estimates of the natural or trend rate of unemployment.
Important changes in the age and skill composition of the labor force over the past two decades may have lowered the trend rate of unemployment. First, the share of older individuals in the labor force has increased as baby boomers have grown older; in addition, many older workers remain in the workforce longer than in the past. An aging labor force contributes to a lower natural rate, because the unemployment rate declines with age.
Second, technological advancements have led to changes in the composition of jobs and skills demanded in the labor force. More specifically, “job polarization” has resulted in a shift away from middle-skill occupations and toward high- and low-skill occupations (Autor and others; Goos and Manning; Autor; Tüzemen and Willis). Workers suitable for high-skill occupations tend to have lower unemployment rates compared with workers suitable for middle-skill occupations, which implies that job polarization may have lowered the trend rate of unemployment.
In this bulletin, I present a new estimate of the natural rate of unemployment that accounts for changes in the age, sex, and skill composition of the labor force. In constructing this estimate, I build on a 2015 Chicago Fed study in which Aaronson and others account for similar changes in the age, sex, and educational composition of the labor force and find support for a natural rate of unemployment at or just slightly below 5 percent at the end of 2014. My approach differs from the Chicago Fed study, however, in that I focus on the changes in the skills demanded by employers instead of the educational attainment of workers._
To document changes in the composition of the labor force, I use micro-level data from the Current Population Survey (CPS), commonly referred to as the household survey. I restrict the sample to individuals who are older than 15 and are not employed in the military or agricultural occupations. I also exclude self-employed individuals and those who work without pay to focus on changes in employers’ demand for workers’ skills.
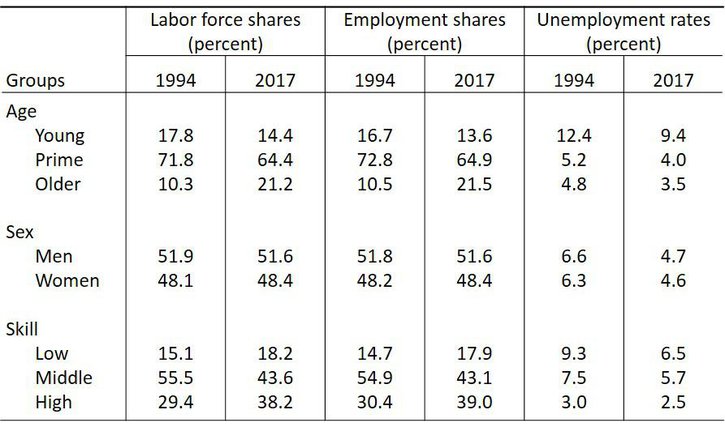
Over the past two decades, the share of older individuals (age 55 and up) in the labor force has significantly increased. While older individuals made up 10 percent of the labor force in 1994, their share more than doubled to 21 percent by 2017 (Table 1). At the same time, the share of young individuals (age 16–24) and prime-age individuals (age 25–54) in the labor force declined. In 2017, the unemployment rate was the lowest for older individuals at 3.5 percent; prime-age workers and young workers had unemployment rates of 4.0 percent and 9.4 percent, respectively. Since the unemployment rate declines with age, an aging labor force would lead to a decline in the natural rate of unemployment.
Table 1: Labor Force Shares, Employment Shares, and Unemployment Rates by Age, Sex, and Skill

Notes: The sample excludes individuals in agriculture and military occupations and who are self-employed or work without pay. Reported shares and rates correspond to monthly averages for each year.
Sources: CPS and author’s calculations.
The demand for workers’ skills has also changed significantly over time, as job polarization has shifted demand away from workers suitable for middle-skill occupations and toward workers suitable for high- and low-skill occupations. While middle-skill occupations still make up the largest share of total employment, their share dropped from 55 percent in 1994 to 43 percent in 2017. At the same time, technological advancements and widespread computer adoption have led to a rise in the relative demand for high-skill workers. The employment share of high-skill occupations increased from 30 percent in 1994 to 39 percent in 2017. Similarly, the employment share of low-skill occupations increased from 15 percent in 1994 to 18 percent in 2017.
Job polarization has likely led to a lower natural rate of unemployment, because workers suitable for high-skill occupations tend to have a lower unemployment rate than workers suitable for middle-skill occupations. For example, the unemployment rate for workers in high-skill occupations was 2.5 percent in 2017, much lower than the unemployment rate of 5.7 percent for workers in middle-skill occupations and 6.5 percent for workers in low-skill occupations._
To construct a new estimate of the natural rate of unemployment that accounts for these compositional changes in the labor force, I divide the population into 18 distinct groups that combine two sex groups (men and women), three age groups (young, prime-age, and older), and three skill groups (low, middle, and high skill). While the sex composition of the labor force has not changed much since 1994 (as indicated in Table 1), job polarization has had different effects on men and women, as well as on workers in different age groups (Tüzemen and Willis). Consequently, I consider separate age-sex-skill groups in this bulletin.
In calculating the new natural rate, I hold the unemployment rate for each age-sex-skill group fixed at its level in the second half of 2005. However, group shares vary over time as indicated by the data. Following the Chicago Fed study, I choose the second half of 2005 as the base year, because it was the last time prior to the Great Recession that the actual unemployment rate was equal to the Congressional Budget Office’s (CBO) estimate of the natural rate of unemployment. Therefore, the calculation assumes that the unemployment rates for each group were at their trend rates in 2005 and that the changes in the composition of groups determine changes in the trend unemployment rate. The natural rate of unemployment corresponds to the average of the unemployment rates weighted with the labor force shares for each group. My calculation differs from the Chicago Fed’s in that I use actual, rather than trend, estimates of the group-specific labor force shares, and I do not make an adjustment to the natural rate estimate for factors specific to the Great Recession.
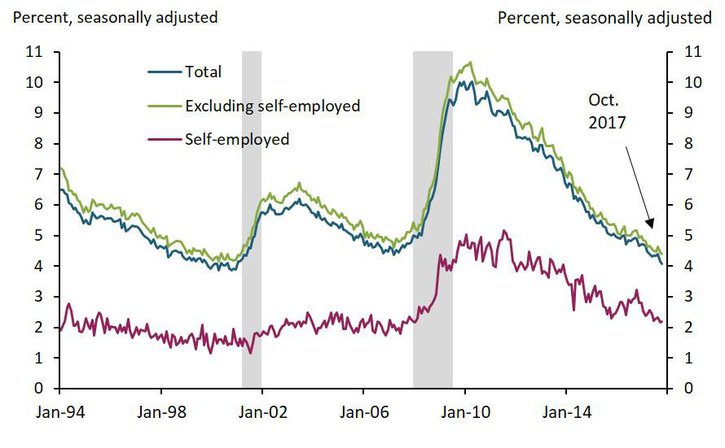
Next, I adjust the calculated natural rate series to include self-employed individuals to get an estimate of the natural rate for the entire labor force._ Self-employed individuals tend to have lower unemployment rates compared with the rest of the labor force (Chart 1). Since 1994, the labor force share of self-employed individuals has averaged around 10 percent. In adjusting the natural rate to include the self-employed, I hold the unemployment rate for the self-employed fixed at its level in the second half of 2005 but allow the labor force share to vary with time. I obtain the new natural rate as the average of the unemployment rates of the self-employed and the rest of the sample weighted by their labor force shares.
Chart 1: Unemployment Rates for Different Groups

Notes: Gray bars denote National Bureau of Economic Research (NBER)-defined recession. All series are monthly and exclude individuals in agriculture and military occupations.
Sources: CPS, NBER (Haver Analytics), and author’s calculations.
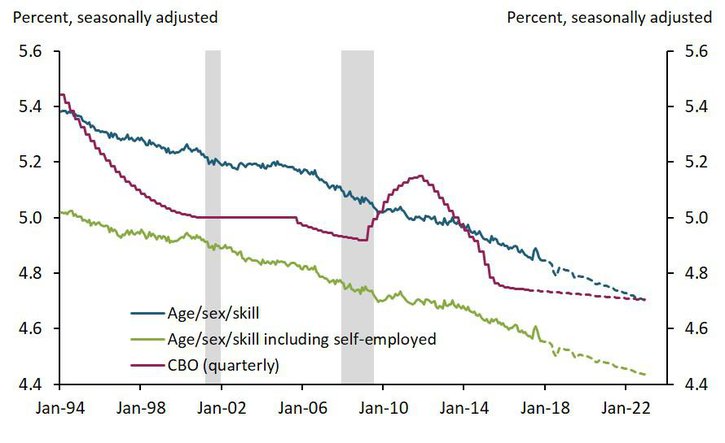
Based on this new estimate, the natural rate of unemployment declined by 0.4 percentage point since 1994:Q1 and is currently 4.6 percent (Chart 2)._ This decline is partly due to ongoing demographic changes related to an aging workforce. But it also reflects longer-term changes in the composition of jobs and skills demanded due to job polarization.
Chart 2: Calculated Natural Rate of Unemployment with Projections
Chart 2: Calculated Natural Rate of Unemployment with Projections

Notes: Gray bars denote NBER-defined recession. Calculated series are monthly and exclude individuals in agriculture and military occupations.
Sources: CBO, CPS, NBER (Haver Analytics), and author’s calculations.
How much of the decline does job polarization account for? When I repeat the natural rate calculations using only age-sex groups, the decline in the natural rate from 1994:Q1 to 2017:Q3 is 0.2 percentage point. Comparing this measure with the 0.4 percentage point measure from the calculations with age-sex-skill groups suggests that around half of the decline in the trend rate is due to an aging labor force, while the rest is due to job polarization. But this share measure is only a rough estimate, as changes in the demand for skills have also affected the age composition of the labor force. As Tüzemen and Willis discuss, the increased demand for high-skill workers led some older workers to delay retirement, contributing to the aging of the labor force. Therefore, this share measure does not perfectly disentangle the effects of aging and job polarization on the natural rate of unemployment.
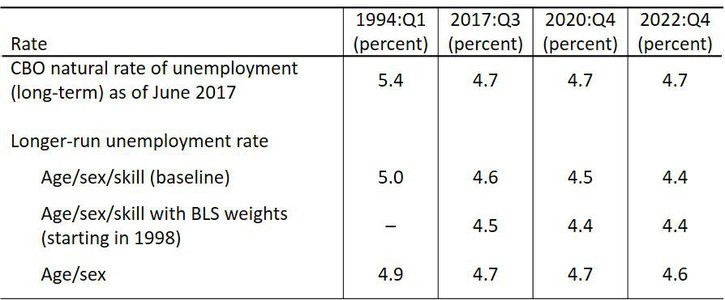
Finally, I use my new estimate to project the natural rate of unemployment through 2022. I assume the changes in the labor force shares of each age-sex-skill group can be approximated linearly from the second half of 2005 to 2017. The projected series imply the natural rate will drop to 4.5 percent by the end of 2020 and drop further to 4.4 percent by the end of 2022 (Table 2). These numbers are in line with the projections in the Chicago Fed study, which suggest that demographic and educational changes will lower the natural rate to around 4.4 to 4.8 percent by 2020. However, my estimate is lower than the CBO’s projection of 4.7 percent in 2022.
Table 2: Alternative Calculations of the Natural Rate of Unemployment with Projections

Note: Calculated numbers correspond to monthly averages for each quarter and exclude individuals in agriculture and military occupations.
Sources: CBO, CPS, and author’s calculations.
Endnotes
-
1
As mentioned in the Chicago Fed Study, due to the strong inverse relationship between education and unemployment, educationally adjusted trend series can imply very high unemployment rates in earlier years, when educational attainment was lower (Summers). Furthermore, educational attainment is up to the decision and ability of a worker, creating a selection problem (Shimer). Given these criticisms, I consider changes in the demand for workers’ skills, not changes in their educational attainment.
-
2
Unemployment rates have been adjusted to include unemployed individuals who do not report an occupation.
-
3
Individuals who report working without pay correspond to less than 0.1 percent of the labor force and are included in these calculations along with the self-employed.
-
4
The “final weights” in the CPS are used for these calculations. When the same calculations are repeated with the “composited final weights” (used by the BLS to create labor force statistics) the natural rate of unemployment is 4.5 percent.
References
Aaronson, Daniel, Luojia Huo, Arian Seifoddini, and Daniel G. Sullivan. 2015. “Changing Labor Force Decomposition and the Natural Rate of Unemployment.” Chicago Fed Letter, 338.
Autor, David H. 2010. “The Polarization of Job Opportunities in the U.S. Labor Market: Implications for Employment and Earnings.” Center for American Progress and the Hamilton Project.
Autor, David H., Lawrence F. Katz, and Melissa S. Kearney. 2006. “The Polarization of the U.S. Labor Market.” American Economic Review Papers and Proceedings, vol. 96, no. 2, pp. 189–194.
Goos, Maarten, and Alan Manning. 2007. “Lousy and Lovely Jobs: The Rising Polarization of Work in Britain.” The Review of Economics and Statistics, vol. 89, no. 1, pp. 118–133.
Shimer, Robert. 1999. “Why is the U.S. Unemployment Rate So Much Lower?” in Ben S. Bernanke and Julio J. Rotemberg, eds., NBER Macroeconomics Annual 1998, vol. 13, pp. 11–61. Cambridge: MIT Press.
Summers, Lawrence H. 1986. “Why is the Unemployment Rate So Very High Near Full Employment?” Brookings Papers on Economic Activity, vol. 17, no. 2, pp. 339–383.
Tüzemen, Didem, and Jonathan L. Willis. 2013. “The Vanishing Middle: Job Polarization and Workers’ Response to the Decline in Middle-Skill Jobs.” Federal Reserve Bank of Kansas City, Economic Review, vol. 98, no. 1, pp. 5–32.
Didem Tüzemen is an economist at the Federal Reserve Bank of Kansas City. Emily Pollard, a research associate at the bank, helped prepare the article. The views expressed are those of the author and do not necessarily reflect the positions of the Federal Reserve Bank of Kansas City or the Federal Reserve System.
