Trade is an important source of demand and supply for U.S. agricultural commodities and food products. According to the U.S. Department of Agriculture (USDA), the United States exported roughly $175 billion in agricultural products in 2024 and imported $215 billion. U.S. markets of many key farm commodities and foods depend substantially on individual trading partners. Abrupt changes related to trade of those products could disrupt markets and alter prices for agricultural producers and consumers.
U.S. agricultural trade is particularly concentrated among Mexico, Canada, and China. The left panel of Chart 1 shows that these nations were the destination for about 50 percent of the total value of U.S. agricultural exports in 2024. The right panel shows that Mexico and Canada are also important sources of agricultural products, accounting for over 40 percent of all U.S. agricultural imports. These two nations were by far the largest individual import partners, with China contributing a much smaller portion. Additionally, Canada is also a major supplier of essential fertilizers used in crop production (Paulson, Schnitkey, and Coppess 2025).
Chart 1: Mexico, Canada, and China are by far the most important trading partners for U.S. agriculture
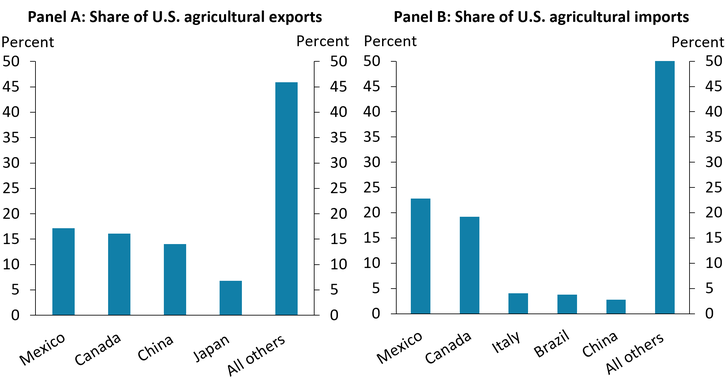
Sources: USDA and author’s calculations.
Despite its relatively low importance as an exporter of agricultural products to the United States, China is a particularly important destination for soybeans and other bulk farm commodities that rely heavily on export markets. Chart 2 shows that 20 percent of U.S. soybean production is exported to China (green bars). In addition to soybeans, roughly 55 percent of sorghum production, 20 percent of cotton production, and 8 percent of U.S. tree nut production (including 18 percent of pistachios) are exported to China.
Chart 2: China, Mexico, and Canada are important export markets for several key U.S. farm commodities
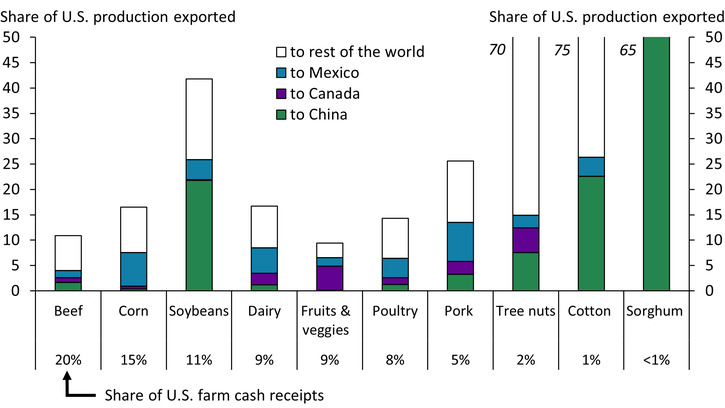
Note: Cash receipts for cattle and hogs are used to represent beef and pork.
Sources: USDA and author’s calculations.
China’s relative importance as a destination for U.S. agricultural products made the sector more vulnerable during past trade disputes. In 2018, China responded to U.S. tariffs by implementing a 25 percent tariff on U.S. soybeans, which led to an immediate and sharp reduction in U.S. soybean exports and prices and a reshuffling of global exports. The disruption also likely reduced the longer-term competitiveness of U.S. exports in world markets by expanding soybean production and exports in other countries (Cowley 2020).
In addition to China, Mexico and Canada are important destinations for several major farm commodities that rely more moderately on exports. Chart 2 shows that 5–7 percent of U.S. corn, dairy, poultry, and pork production is exported to Mexico (blue bars). Moreover, about 5 percent of U.S. fruit, vegetable, and tree nut production is exported to Canada (purple bars). Higher Mexican and Canadian tariffs on these products would likely reduce demand and lead to lower prices. The figures at the bottom of Chart 2 show that these commodities also account for a large share of U.S. farm cash receipts, and broad price declines could collectively reduce aggregate farm revenues considerably.
In addition to their role as a destination for U.S. agricultural products, Mexico and Canada are also primary sources of many staple food products consumed in the United States. Chart 3 shows that about 20 percent of U.S. fruit, vegetable, and tree nut consumption is imported from Mexico, and another 5 percent is imported from Canada. Those product categories account for about 17 percent of the “food-at-home" (grocery) basket of the Consumer Price Index (CPI), a common measure of food inflation. Canada and Mexico also supply about 13 percent of cereals and bakery products consumed in the United States, 13 percent of nonalcoholic beverages, and 10 percent of other processed foods such as condiments, milled grain products, sweets, and vegetable oils. These items collectively make up around 35 percent of the CPI’s food-at-home basket. Tariffs on these products could contribute to higher food inflation for U.S. consumers if suppliers pass on the costs to consumers.
Chart 3: Imports from Mexico and Canada make up a large share of several staple U.S. consumer products
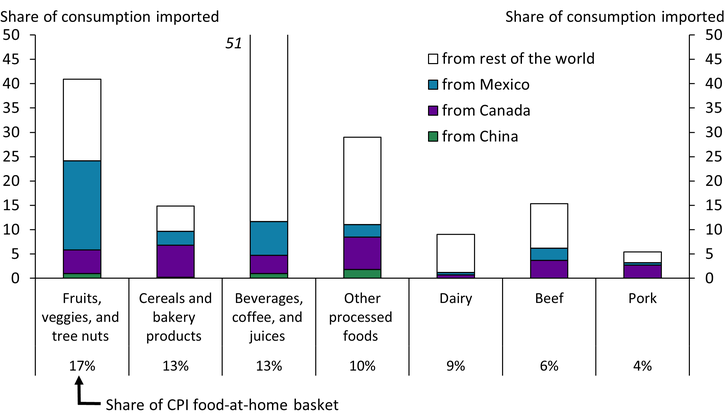
Sources: USDA, U.S. Bureau of Labor Statistics, and author’s calculations.
The scale and duration of food price increases from tariffs would likely vary depending on the reshuffling of trade, the flexibility of production, and the degree to which producers pass costs on to retailers. Because many fresh fruits and vegetables rely heavily on imports from concentrated growing areas and substitutes are limited, tariffs related to these commodities could contribute to modest increases in consumer prices that persist for a longer period. For processed foods with flexible supply chains that could shift production, price increases could be modest but more temporary.
The composition of U.S. agricultural exports and imports suggests that the agricultural sector is highly exposed to risks of disrupted trade with Mexico, Canada, and China. These countries are key destinations for several agricultural products that account for a large share of farm revenues. Moreover, Mexico and Canada are key suppliers of products that make up a large share of the U.S. food-at-home basket. Tariffs on U.S. exports could lead to a reduction in aggregate farm revenues, while tariffs on U.S. imports could lead to increases in food prices. The degree of effect would depend heavily on the scope, level, and duration of any tariffs or other changes in trading partnerships.
Download Materials
Article Citation
Kreitman, Ty. 2025. "Key Agricultural Trade Partners Are Important for U.S. Farm Sector Revenues and Food Prices." Federal Reserve Bank of Kansas City, Economic Bulletin, April 4.
References
Cowley, Cortney. 2020. “External LinkReshuffling in Soybean Markets following Chinese Tariffs.” Federal Reserve Bank of Kansas City, Economic Review, vol. 105, no. 1, pp. 57–82.
Paulson, Nick, Gary Schnitkey, Jonathan Coppess, and Carl Zulauf. 2025. “External LinkTariff Threats and U.S. Fertilizer Imports.” University of Illinois Department of Agricultural and Consumer Economics, farmdoc daily, vol. 15, no. 21, February 4.
Ty Kreitman is an associate economist at the Federal Reserve Bank of Kansas City. The views expressed are those of the author and do not necessarily reflect the positions of the Federal Reserve Bank of Kansas City or the Federal Reserve System.
Author
