Against the backdrop of pervasive underfunding, many state and local pension plans have increasingly turned to alternative investments such as private equity, hedge funds, and real estate in recent years. This trend has raised concerns about whether the pension plans are chasing yield—and whether recent changes in the investment portfolio are increasing the volatility of returns.
The ratios of asset values to future pension liabilities, known as “funded ratios,” have declined for state and local pension plans. Chart 1 shows that according to Public Plans Data, the median funded ratio across 173 state and local pension plans has trended down since 2001._
Chart 1: Funded Ratio (Asset Value over Present Value of Pension Liabilities)
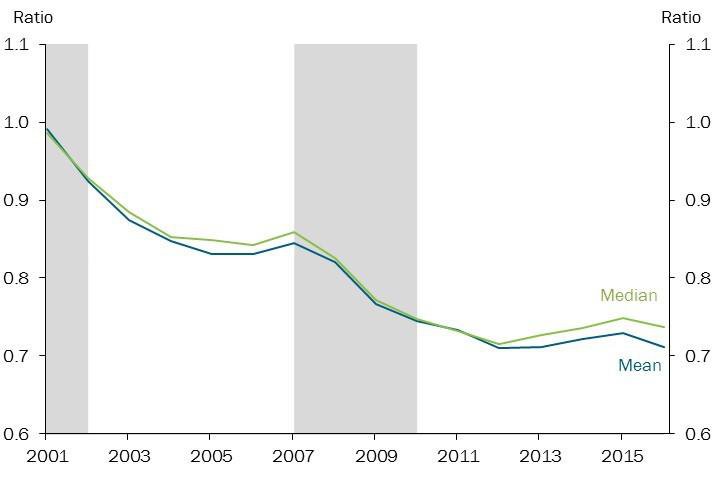
Note: Gray bars denote National Bureau of Economic Research (NBER)-defined recessions.
Sources: NBER and Public Plans Data from the Center for Retirement Research at Boston College (CRR), Center for State and Local Government Excellence (SLGE), and National Association for State Retirement Administrators (NASRA).
The asset composition of pension plans changed over the same period: by the end of 2015, 151 of these plans had alternative investments compared with only 71 plans in 2001.
Chart 2 shows that many plans that had no exposure to alternative investments in 2001 had ramped up their shares by 2015. The overall share of the portfolios for the 173 plans in alternative investments rose from 3.8 percent in 2001 to 18 percent in 2015 (Chart 3). Complementing the rise in alternative investments, the share in traditional equities and bonds declined by 11.4 percent over the same period.
Chart 2: Portfolio Share of Alternative Investments
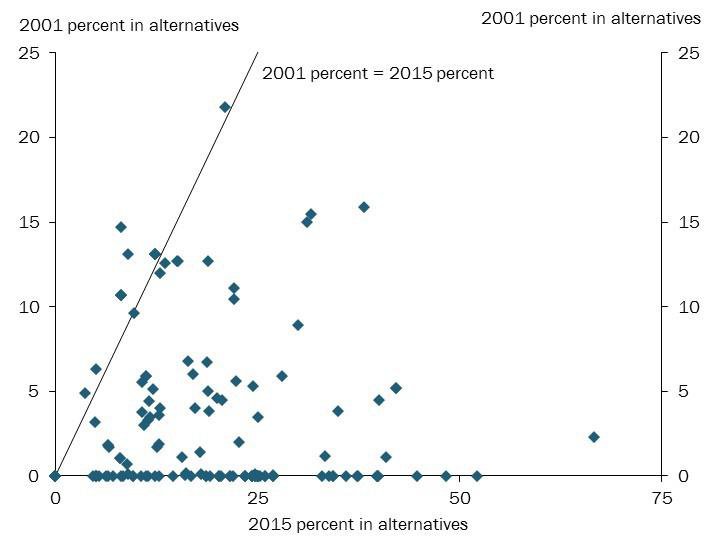
Sources: CRR, SLGE, and NASRA.
Chart 3: Pensions’ Assets by Type
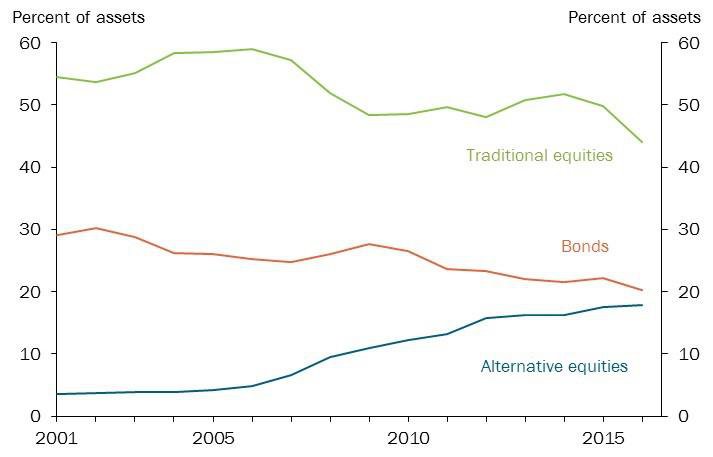
Chart 3: Pensions’ Assets by Type
Has underfunding driven the asset allocation of public pensions toward alternative investments? To answer this question, we use panel data to regress pension plans’ share of assets in alternative investments on their funded ratio and fixed effects._ Our results suggest that the shift toward alternative investments appears to be across the board; underfunding only partially explains this shift. Instead, the majority of the increase in the alternative investment share is explained by year effects, which capture the influence of aggregate trends. For instance, pension plans may have had easier access to alternative investments in recent years, or pension asset managers may have changed their preferences for alternative investments.
The blue bars in Chart 4 show the year effects: controlling for funded ratios and pension-specific characteristics, pension plan managers invested 14 percent more of plan assets in alternative investments in 2016 than in 2001. The green bars show that the decline in funded ratios explains part of the increase in the alternative investment share—the effect, however, is modest. For instance, a decline in the funded ratio of 0.3, equal to the change in the median funded ratio from 2001 to 2016, raises the share in alternative investments by 2 percent.
Chart 4: Effects on Average Alternative Investment Holding
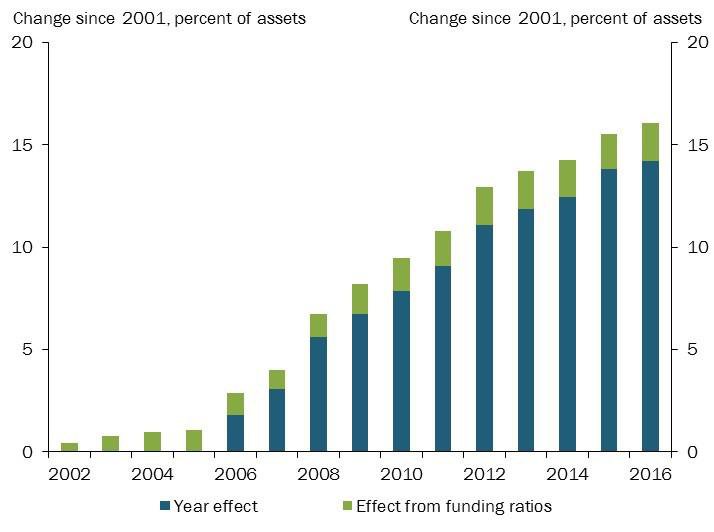
Sources: CRR, SLGE, NASRA, and authors’ calculations.
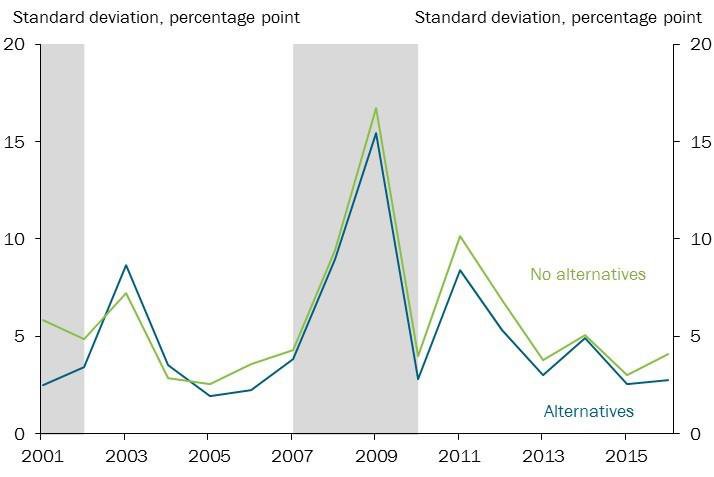
Has the shift to alternative investments since 2006 increased the volatility of investment returns? If so, public pensions are likely to face a higher risk of shortfalls in future economic downturns—which, in conjunction with an aging society, will raise the likelihood of fiscal crises. To address this question, we split the 173 state and local pension plans into two groups—those with alternative investments and those without—and compute the return volatilities for both groups from 2001 to 2016. Chart 5 shows the two groups have no significant differences, implying that investing in alternative equities doesn’t necessarily increase volatility.
Chart 5: Standard Deviations of One-Year Returns
Sources: CRR, SLGE, and NASRA.
A closer look at specific investment portfolios reveals that pension plans may pursue different investment strategies within the category of alternative equities. For example, according to the CRR, the Texas Employee Retirement System (TERS) and California Public Employees’ Retirement System (CPERS) had similar funded ratios in 2015 at 0.76 and 0.73, respectively. But according to Bloomberg, the two plans have distinct investment portfolios under the category of private equity: while CPERS assets are more concentrated in buyouts, the TERS portfolio is more diversified, including buyouts, real assets, and ventures.
Given the differences in investment strategies across pension plans, it is difficult to make any definitive conclusions about the cause or implications of the recent move toward alternative equities. Our results suggest, however, that a shift toward alternative equities alone may not signal a riskier investment strategy. While some pension managers may have turned to alternative equities to remedy funding shortfalls, others may have turned to alternative equities to diversify their portfolios, thereby lowering the volatility of their returns.
Endnotes
-
1 In funded ratios, future pension liabilities are calculated in terms of present value. Novy-Marx and Rauh, among others, have argued that the official funded ratios underestimate the present value of future pension liabilities, as pension plans use the expected returns on their investment (in the range of 7.5–8.5 percent) as discount rates.
-
2 Specifically, we regress the asset shares of alternative equities on funded ratios, conditional on year-specific effects and pension fixed effects. Year effects from 2006 to 2016 and the effect of funded ratios on the alternative equity share are statistically significant at the 0.1 percent level.
Reference
Novy-Marx, Robert, and Joshua Rauh. 2011. “Public Pension Promises: How Big Are They and What Are They Worth?” Journal of Finance, vol. 66, no. 4, pp. 1211–49.
Huixin Bi is a senior economist at the Federal Reserve Bank of Kansas City. Trenton Herriford is an assistant economist at the bank. The views expressed are those of the authors and do not necessarily reflect the positions of the Federal Reserve Bank of Kansas City or the Federal Reserve System.
Author