Hybrid working has reshaped where households and businesses choose to locate, with especially notable effects on demand for downtown office space. The blue line in Chart 1 shows that office attendance, one indicator of office demand, has fallen dramatically in large metropolitan areas. During the initial lockdown in the spring of 2020, average weekly office attendance—the number of employee badge swipes at offices over the course of a week—plunged to 20 percent of its pre-pandemic level. Since then, attendance has gradually rebounded, settling at about 50 percent of its pre-pandemic level in mid-2023. Austin (green line) and San Francisco (orange line) have typically had the highest and lowest attendance rates, settling around 60 and 40 percent, respectively. An alternative measure of office demand, peak weekly attendance, measures the number of employee badge swipes on the day each week with the most swipes (typically on Wednesdays). This has settled somewhat higher than average weekly attendance, ranging from 50 percent in San Francisco to 75 percent in Austin._
Chart 1: Office attendance has fallen considerably in large metropolitan areas
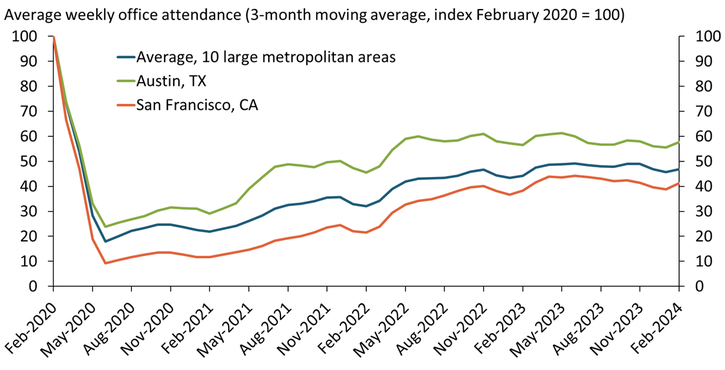
Note: Underlying data extend through February 2024 and are based on swipes of badges at the approximately 2,600 office buildings secured by Kastle Systems in New York, Los Angeles, Chicago, Dallas, Houston, Washington D.C., Philadelphia, San Francisco, Austin, and San Jose.
Source: Kastle Systems (Haver Analytics).
Rented office space, another indicator of office demand, has also declined in most metropolitan areas, but by far less than attendance. The blue line in Chart 2 shows rented office space relative to its pre-pandemic level, aggregated across 52 medium and large metropolitan areas. Throughout 2023, aggregate rented office space hovered near 95 percent of its pre-pandemic level. However, the decline was greater for rented office space in metropolitan downtowns (green line), which settled near 93 percent of its pre-pandemic level.
Chart 2: Rented office space has declined by far less than attendance
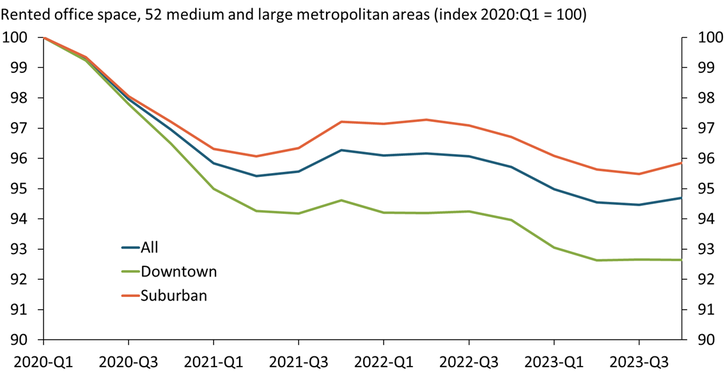
Notes: Chart shows aggregate rented space not available for sublet, summed over 52 metropolitan areas. Data extend through 2023:Q4.
Source: CBRE Econometric Advisors.
The smaller decline in rented space compared with attendance may partly reflect delayed downsizing due to the gradual expiration of leases. But the smaller decline may also reflect businesses’ hesitancy to proportionally downsize. For example, businesses may choose to keep dedicated space for each of their employees or increase the amount of common space, as office setups are an important dimension of competition in hiring.
The change in the level of rented office space since the pandemic has varied considerably across metropolitan areas. Chart 3 shows how rented space in 52 metropolitan downtowns changed from 2020:Q1 to 2023:Q4. San Francisco’s downtown experienced the largest decline, with rented office space falling to 74 percent of its pre-pandemic level. In sharp contrast, rented office space in downtown Tucson increased by 16 percent, partly reflecting a strong upward trend prior to the pandemic. More broadly, rented office space increased in 13 of the 52 downtown markets shown in Chart 3 and declined by less than 5 percent in 10 of them. What accounts for this variation is unclear. A fitted line of the scatter (not shown) shows that the change in rented downtown office space is slightly negatively correlated with metropolitan population. However, the variation in metro size accounts for only 10 percent of the variation in relative rented space, implying that most of the variation reflects other factors. An alternative plot, showing the scatter of rented space in 2023:Q3 against what rented space would have been if pre-pandemic trends had continued, is characterized by a similar degree of variation.
Chart 3: Change in rented office space has varied considerably across metropolitan downtowns
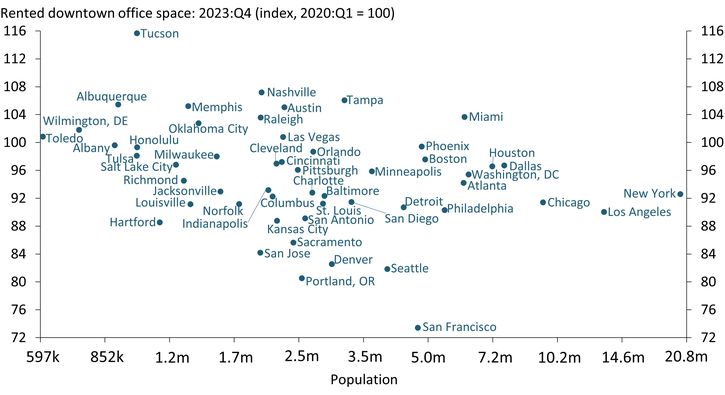
Note: Chart shows aggregate rented space not available for sublet. Horizontal axis is on a logarithmic scale.
Sources: CBRE Econometric Advisors and author’s calculations.
Similar to rented office space, changes in rental prices have also varied considerably across metropolitan downtowns. Chart 4 shows that from 2020:Q1 to 2023:Q4, downtown office rent fell to 70 percent of its pre-pandemic value in San Franciso but increased to 135 percent of its pre-pandemic value in Miami._ Explicitly accounting for inflation leaves the variation essentially unchanged. A best fit line (not shown) demonstrates that the change in rents is uncorrelated with the initial level of rents, measured by the horizontal axis, suggesting differences in initial rent prices across metro areas do not account for the variation.
Chart 4: Change in office rents has varied considerably across metropolitan downtowns
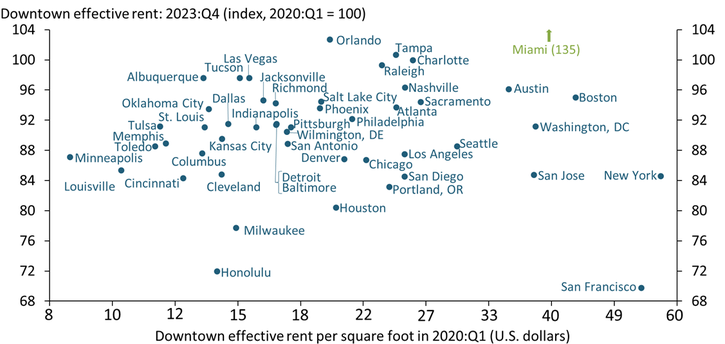
Notes: Horizontal axis uses a logarithmic scale, with labels rounded to nearest dollar. Effective rent is estimated by CBRE Econometric Advisors incorporating base rent, escalations, free rent, and tenant improvement allowances.
Sources: CBRE Econometric Advisors and author’s calculations.
Changes in rents may reflect changes in supply in addition to changes in demand. For example, completion of new office space can drive down rents even if demand remains unchanged. Supply considerations suggest that the change in rents may understate the change in demand for office space in some metropolitan downtowns. In particular, several downtowns with the highest rents relative to 2020:Q1 experienced large increases in rentable office space. For example, rents in Austin and Nashville in 2023:Q4 were both 96 percent of their pre-pandemic levels even though each experienced increases in rentable office space of more than 25 percent. Reciprocally, rents in San Francisco and Honolulu dropped substantially relative to their pre-pandemic levels, despite no change in either’s rentable downtown space.
The continued strong demand for office space in several metropolitan downtowns implies that the shift to hybrid working need not hurt downtown business districts and the municipalities that depend on them. A better understanding of the factors driving the wide variation in office demand may help guide public policy in fostering the health of downtowns.
Endnotes
-
1 Recent research also suggests that office attendance has declined only modestly in small metropolitan areas (Monte, Porcher, and Rossi-Hansberg 2023).
-
2 Chart 2 is based on aggregated data across 52 of the 64 Tier 1 metropolitan markets defined by CBRE Econometric Advisors. Chart 3 covers the downtowns of 52 metropolitan areas, including most of the same metros as Chart 2 but also others in the excluded Tier 1 markets. Chart 4 covers 49 of the 52 metropolitan downtowns in Chart 3.
Reference
Monte, Ferdinando, Charly Porcher, and Esteban Rossi-Hansberg. 2023. “External LinkRemote Work and City Structure.” National Bureau of Economic Research, working paper no. 31494, July.
Jordan Rappaport is a senior economist at the Federal Reserve Bank of Kansas City. The views expressed are those of the author and do not necessarily reflect the positions of the Federal Reserve Bank of Kansas City or the Federal Reserve System.
Author
