U.S. benchmark interest rates, such as the federal funds rate and the 10-year Treasury yield, stand near two-decade highs following a period of monetary policy tightening that began in 2022. Higher interest rates can present challenges for many economic actors, including banks. For example, Laliberte and Sengupta (2024) find that banks with greater shares of non-deposit funding and commercial real estate loans were more likely to experience declining net interest margins (NIMs) during the 2022–23 period of policy tightening. While community banks—typically defined as institutions with less than $10 billion in total assets—are less reliant on non-deposit funding, higher interest rates can still weigh on their profitability, as measured by NIMs. Community banks often rely on a traditional banking model, in which they make local loans with local deposits. When interest rates are high, community bank profitability may be especially vulnerable to rising deposit costs, fixed asset yields, and increases in non-performing loans.
Nevertheless, as of 2024:Q4, two-thirds of community banks reported NIMs at or above their levels in 2022:Q1._ To explore why profitability increased at some banks but not others, I first break down changes in NIMs into changes in their two components—asset returns and funding costs (liabilities). Chart 1 shows how changes in these components contributed to profitability at banks with increasing NIMs from 2022:Q1 to 2024:Q4 (“margin-increasing banks”) as well as at banks with decreasing NIMs (“margin-decreasing banks”)._
Chart 1: Asset returns rose by more than funding costs for banks with increased profitability
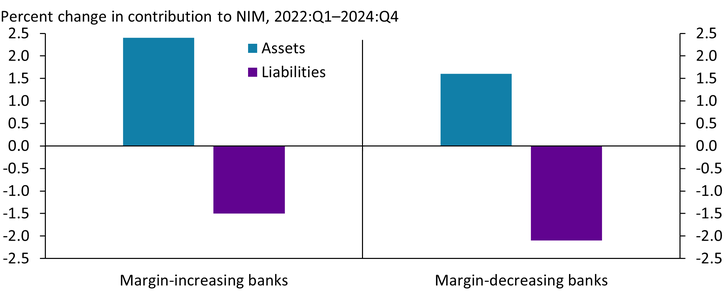
Notes: Contributions from assets (liabilities) are calculated as the percentage of total interest income (expenses) relative to total interest-earning assets in a given period. The change in contribution is defined as the difference in relative interest earnings (expenses) between the two periods.
Sources: FFIEC and author’s calculations.
From 2022:Q1 to 2024:Q4, community banks were both earning more interest on their assets and paying more interest on their liabilities. While higher earnings on assets (blue bars) increase NIMs, rising funding costs (purple bars) decrease NIMs. The left side of the chart shows that contributions from higher asset yields more than offset the contribution from higher funding costs for margin-increasing community banks—two-thirds of the banks in our sample. However, the right side of the chart shows that contributions to NIMs from higher funding costs outstripped the contribution from higher asset yields for margin-decreasing banks.
To better understand the factors driving changes in both funding costs and asset yields during the 2022:Q1–2024:Q4 period, I next examine how the individual components of assets and liabilities contributed to changes in NIMs. Importantly, changes in both the yield of an asset (or liability) and the share of the asset held on a bank’s portfolio can contribute to changes in NIMs._
Chart 2 shows that both the composition of assets (textured blue bars) and those assets’ yields (solid blue bars) changed meaningfully from 2022 to 2024 for both margin-increasing and margin-decreasing banks. Margin-increasing banks reduced their deposits held at other banks—considered the lowest-yielding assets—as yields rose elsewhere. They also reduced their share of securities holdings while increasing earnings from the securities holdings remaining in their portfolios. This reduction in their securities portfolio could reflect securities maturing during the tightening cycle or sales of securities whose value had eroded in response to rising interest rates._ Margin-increasing banks largely offset their lower reserves and securities holdings with increased loan holdings, particularly real estate loans. This shift from lower-earning to higher-earning assets helped to boost these banks’ NIMs. While margin-decreasing banks generally saw their portfolio composition and yields move in a similar direction, they had smaller changes to both their securities holdings and the yields on those securities, resulting in smaller relative increases to more profitable lending portfolios. In addition, their lending declined across all loan types except real estate, with the increase in real estate loan issuance amounting to half of the increase for margin-increasing banks.
Chart 2: Changes in portfolio composition and yields drove variations in interest earnings
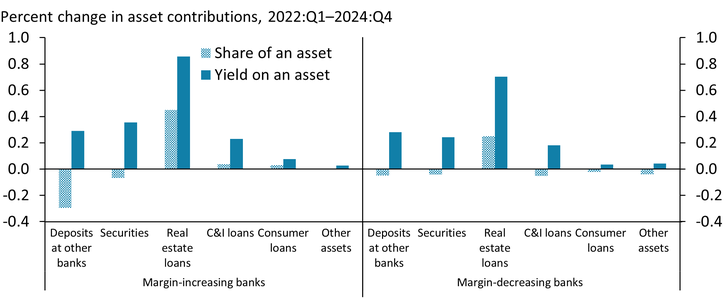
Notes: The chart omits the “other loans” category, as it represents the residual of total loans and exhibits high volatility from quarter to quarter. Variations in this category did not materially influence asset earnings during the given period.
Sources: FFIEC and author’s calculations.
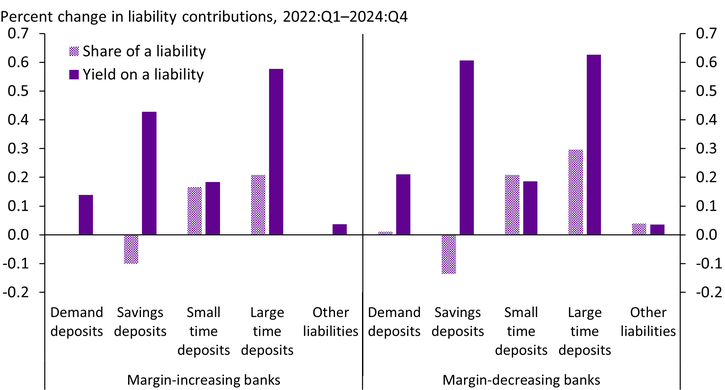
Chart 3 performs a similar exercise for funding costs, illustrating how changes in both the share and yield of liabilities on community banks’ portfolios contributed to NIMs. Demand deposits (checking accounts) and savings deposits are the cheapest liabilities for banks because these accounts tend to pay lower interest rates than other liabilities. Chart 3 shows that margin-increasing community banks had smaller rate increases across deposit types than margin-decreasing banks. At the same time, margin-increasing banks had smaller outflows of low-yield savings deposits than margin-decreasing banks and no change to demand deposit shares. Comparatively, margin-decreasing banks relied more heavily on higher-cost time deposits and paid more to retain their demand and savings deposits. These results support prior research showing that banks with weak deposit franchises are more vulnerable to depositor flight when interest rates rise._
Chart 3: Stable and low-cost funding base underpins banks’ NIM resilience
Sources: FFIEC and author’s calculations.
The extended low-rate period that prevailed during and immediately after the pandemic limited high-yield investment options and left banks with a large stock of low-yield assets and a substantial depositor base. However, as rates began to rise in early 2022, banks quickly saw their deposits flow into higher-yield alternatives such as money market funds. This analysis shows that the banks that were able to retain their low-cost deposit base and rebalance their asset holdings to higher earning assets were more profitable during the most recent rate hike period.
Endnotes
-
1 In 2024:Q4, community banks reported an average NIM of 3.7 percent.
-
2 Margin-increasing and margin-decreasing terminology was first introduced by Laliberte and Sengupta (2024), who explore the differences in bank NIMs and their drivers over the 2022–23 tightening cycle.
-
3 I follow the methodology outlined by Covas, Rezende, and Vojtech (2015) to calculate the contributions of each major balance sheet subcomponent to the overall change in NIM. Following their method, to isolate changes in yields, I look at changes in the average interest earned on an asset or paid on a liability from 2022:Q1 to 2024:Q4, holding that asset or liability’s share at its 2022:Q1 value. Similarly, to isolate changes in shares, I look at changes in the average share of an asset or liability from 2022:Q1 to 2024:Q4, while holding the yield fixed at its 2024:Q4 level. To compare changes in yields and shares between margin-decreasing and margin-increasing banks, I normalize shares and yields of margin-decreasing banks relative to margin-increasing banks.
-
4 For a more detailed discussion on the mechanisms and implications of declines in the value of a bank’s securities portfolio, see Marsh and Laliberte (2023).
-
5 Drechsler, Savov, and Schnabl (2021) show that an unexpected increase in the short rate increases banks’ interest expense relative to their interest income and does not expose banks to interest rate risk if they have the deposit franchise, which allows banks to pay deposit rates that are low and insensitive to market interest rates.
Article Citation
Dzholos, Mariia. 2025. "Community Banks Have Maintained Profitability in a High-Interest Rate Environment." Federal Reserve Bank of Kansas City, Economic Bulletin, April 16.
References
Covas, Francisco B., Marcelo Rezende, and Cindy M. Vojtech. 2015. “External LinkWhy Are Net Interest Margins of Large Banks So Compressed?” Board of Governors of the Federal Reserve System, FEDS Notes, October 5.
Drechsler, Itamar, Alexi Savov, and Philipp Schnabl. 2021. “External LinkBanking on Deposits: Maturity Transformation Without Interest Rate Risk.” Journal of Finance, vol. 76, no. 3, February 15.
Laliberte, Brendan, and Rajdeep Sengupta. 2024. “Why Do Net Interest Margins Behave Differently Across Banks as Interest Rates Rise?” Federal Reserve Bank of Kansas City, Economic Bulletin, March 8.
Marsh, W. Blake, and Brendan Laliberte. 2023. “The Implications of Unrealized Losses for Banks.” Federal Reserve Bank of Kansas City, Economic Bulletin, April 11.
Mariia Dzholos is a research associate at the Federal Reserve Bank of Kansas City. The views expressed are those of the author and do not necessarily reflect the positions of the Federal Reserve Bank of Kansas City or the Federal Reserve System.
Author