Heading into the third quarter of 2022, the Chinese economy seemed to be struggling with substantial headwinds. The enforcement of China’s zero-COVID-19 policy continued to weigh on the economy, disrupting manufacturing and limiting domestic consumption and travel. Indeed, the Chinese economy only grew by 3 percent in 2022, far below the long-run average of 6 to 8 percent. In November 2022, however, the government removed most COVID-19 restrictions, sparking debate over the potential economic effects. Some observers expected a wave of COVID-19 infections to further disrupt the economy, while others expected lifting the restrictions to spur economic growth.
Since then, several data points have suggested that the Chinese economy has started to rebound. Domestic consumption in general—and services consumption in particular—appear to be driving the recovery. The orange line in Chart 1 shows that since China ended its zero-COVID policy, retail sales have grown and are now increasing on a year-over-year basis. The Purchasing Managers Index for services (green line), which provides an outlook for the service industry, has also improved and is currently above its pre-pandemic average (green dot)._ However, the consumer confidence index (blue line) is still negative despite an upward trend. Low consumer confidence suggests consumers could be hesitant to spend, potentially hampering the recovery’s longevity.
Chart 1: Chinese domestic consumption has recently rebounded, but confidence remains low
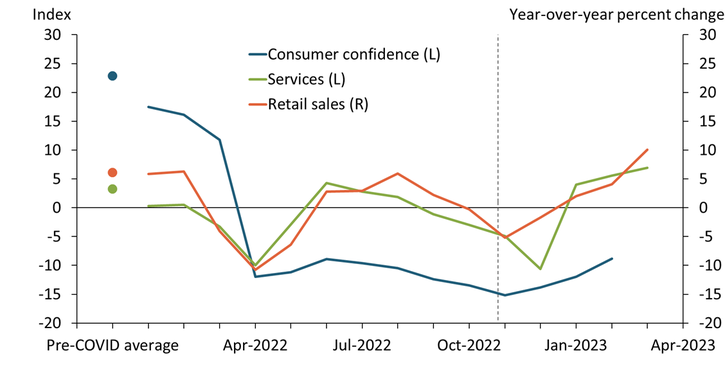
Notes: Dashed line shows end of China’s zero-COVID policy. Dots denote pre-pandemic averages.
Sources: Chinese National Bureau of Statistics (CNBS) and China Federation of Logistics and Purchasing. All data sources accessed via Haver Analytics.
Although domestic consumption began to recover shortly after China lifted its zero-COVID policies, exports have only recently shown signs of recovery. Chart 2 shows year-over-year export growth (blue line) alongside the Purchasing Managers Index of new export orders (green line). In the first half of 2022, Chinese export growth was elevated despite lockdowns, potentially reflecting the strong recovery in durable consumption in the United States and other countries. During the second half of 2022, exports declined, and growth remained subdued until early 2023. More recently, however, exports have begun to recover. As of March 2023, both new export orders and actual exports have started to rise._ If exports continue to grow at this rate, the economic recovery may be more robust. Still, it is too early to tell whether this recent surge in exports will be sustained.
Chart 2: Chinese exports have weakened, but new export orders have grown
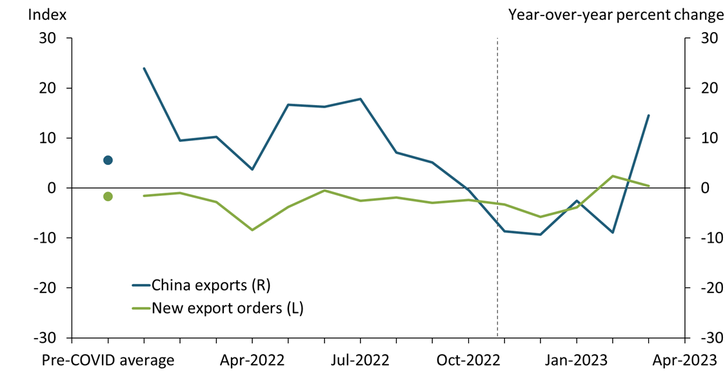
Notes: Dashed line shows end of China’s zero-COVID policy. Dots denote pre-pandemic averages.
Sources: Chinese National Bureau of Statistics (CNBS) and U.S. Census Bureau (both accessed via Haver Analytics).
As consumption and exports rebound, expectations for Chinese GDP growth have risen accordingly. Chart 3 shows forecast revisions for 2023 based on projections from the International Monetary Fund (IMF) and Blue Chip Economic Indicators. The IMF revised its 2023 growth estimates from 4.4 percent in October 2022 to 5.2 percent in April 2023; the Blue Chip consensus forecast was revised up from 4.4 percent in November 2022 to 5.3 in April 2023. Although these revised forecasts remain below China’s 6 percent pre-pandemic growth rate, the upward revisions are substantial.
Chart 3: IMF and Blue Chip forecasters have revised up their expectations for 2023 Chinese GDP
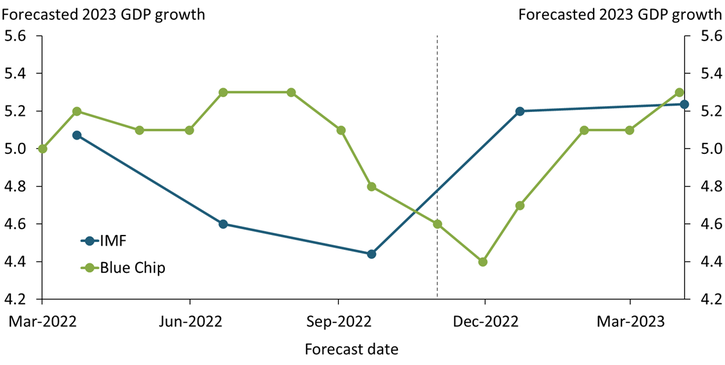
Sources: IMF and Wolters Kluwer (both accessed via Haver Analytics).
How might a rebound in Chinese GDP affect the global growth outlook? To answer this question, we fit a set of simple regression models that estimate the effect of changes in Chinese GDP on Asian emerging economies, global emerging economies, and the overall global economy (all excluding China)._ We then project 2023 GDP growth for these economies under three scenarios. In the first scenario, China’s GDP increases by 4.4 percent, the level forecasters predicted in October 2022. In the second scenario, China’s GDP increases by 5.2 percent, the level corresponding to forecasters’ current expectations. And in the third scenario, China’s GDP increases by 5.6 percent, implying a stronger-than-expected recovery from the pandemic and associated restrictions. We incorporate this third scenario because the lifting of COVID-19 restrictions in both Europe and the United States led to rebounds in economic growth that considerably exceeded forecasters’ expectations.
Chart 4 plots our projections for all three scenarios. One way to interpret these projections is as estimates of how Chinese growth affects broader world economies due to trade linkages. Generally, the improvement in the outlook for Chinese GDP suggests an improvement across all three groups of economies under all three scenarios, though the size of the effect is slightly larger for emerging economies than for the global economy. If we consider the October forecast of 4.4 percent GDP growth as a baseline, the green bars in Chart 4 show that if China’s GDP were to grow by 5.2 percent (consistent with current forecasts), growth in the Asian emerging economies and global emerging economies would be about 0.50 percentage point higher, while global economic growth would be about 0.43 percentage point higher. Similarly, if China’s GDP were to grow by an optimistic 5.6 percent in 2023 (orange bars), growth in emerging economies would increase about 0.75 percentage point, while growth in the global economy would rise 0.65 percentage point.
Chart 4: Revisions to Chinese GDP forecast suggest higher growth for foreign economies
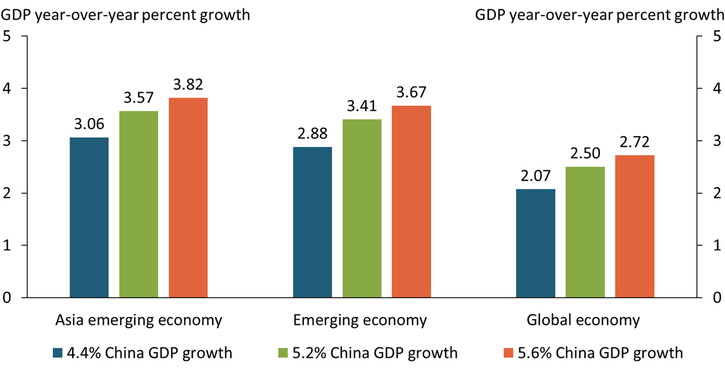
Sources: World Bank (Haver Analytics) and authors’ calculations.
Several factors might complicate these projections by interfering with both the Chinese economic recovery and its spillovers to the broader foreign economy. First, the recovery has been uneven so far, driven largely by consumption. A prolonged recovery will likely require broad, sustained improvement in exports and investments. Second, domestic consumption appears fragile: consumer confidence is low, suggesting consumers may be reluctant to continue spending. One explanation for this low confidence may be the slow recovery in China’s housing market. Housing is the most important investment for Chinese consumers, and concerns about the housing market may make consumers more cautious in general. Third, our projections for foreign economies are based on historical data, in which exports and investments drove Chinese growth rather than consumption. Consumption is more domestically oriented, so spillovers to foreign economies might be more muted during the current recovery than shown in Chart 4.
Because the Chinese rebound has so far been driven primarily by domestic demand, which tends to be less sensitive to imports, we expect only minor effects on U.S. exporters. As the recovery broadens over time, however, Chinese economic growth could spur global growth, with positive effects on the United States.
Endnotes
-
1 The indices in Chart 1 have been normalized so that values above zero indicate a positive outlook. As published, the services index indicates expansionary activity at values above 50, and the consumer confidence index indicates an optimistic outlook at values above 100.
-
2 The Purchasing Managers Index of new export orders in Chart 2 is normalized so that values above zero indicate expansion. As published, expansion is indicated at values above 50.
-
3 Regressions estimate real GDP growth on Chinese real GDP growth, based on chained (2015) U.S. dollars.
Thomas R. Cook is a data scientist at the Federal Reserve Bank of Kansas City. Johannes Matschke is an economist at the bank. The views expressed are those of the authors and do not necessarily reflect the positions of the Federal Reserve Bank of Kansas City or the Federal Reserve System.
Authors

Thomas R. Cook
Data Scientist