Elevated trade policy uncertainty throughout 2025 has led many to wonder how changes in international trade patterns or volumes might affect local economies. Even abstracting from changes in trade policy, geopolitical conflicts, shipping route disruptions, or severe weather events could disrupt trade patterns for some time, with implications for employment in certain industries.
Assessing both industry-level exposures and the implications for employment can be challenging. Some industries are more exposed to cross-border trade than others due to their supply chains, markets for final products, or both. Moreover, state-level import and export data face some limitations, necessitating creative measures to capture regional measures of exposure to international trade._
I assess employment exposure to international trade in the Tenth Federal Reserve District (Colorado, Kansas, Nebraska, Oklahoma, Wyoming, and parts of Missouri and New Mexico) by examining exports as a share of output and imports as a share of inputs used in goods-producing industries._ I define industries with higher exposure to international trade as those where the export share of industry output or import share of industry inputs is greater than the median across industries. Industries with lower exposure are those where the export share of industry output and import share of industry inputs are both below the median across industries.
Employment in industries more exposed to trade is higher in several Tenth District states than in the country as a whole. Chart 1 shows that a greater share of employment in Colorado, Kansas, Missouri, Oklahoma, and Wyoming is in goods-producing industries with relatively higher exposure to international trade (blue bars). A key driver of this higher trade exposure is higher employment in the oil and gas and transportation equipment manufacturing industries, which are more reliant on international suppliers and customers. In contrast, a greater share of employment in states such as Nebraska and New Mexico is in industries that are less exposed to international trade (purple bars). For example, in Nebraska, industries such farming and food and beverage manufacturing account for a larger share of employment. While these industries certainly sell products and purchase inputs internationally, their exposure to international trade is lower than other goods-producing industries.
Chart 1: Share of employment in select goods-producing industries by exposure to international trade, 2022–23 average
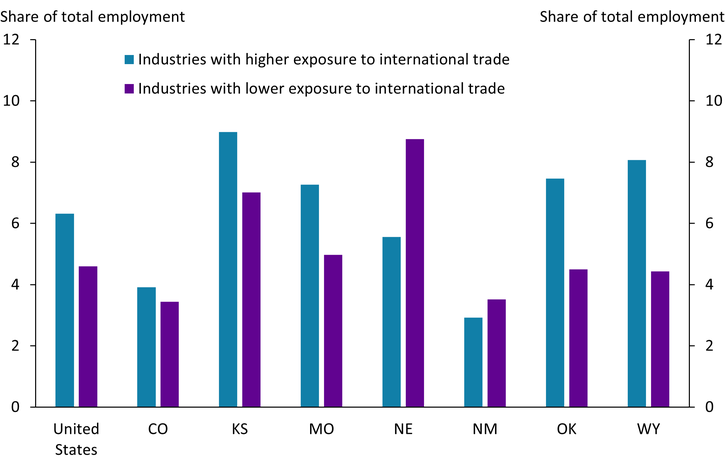
Sources: U.S. Bureau of Labor Statistics (Haver Analytics), U.S. Census Bureau, U.S. Bureau of Economic Analysis (BEA), and author’s calculations.
While an industry’s share of international exports or imported inputs offers critical insight into its exposure to trade disruptions, the number of an industry’s trading partners also matters. Industries with a smaller set of international customers or suppliers are theoretically more likely to come under stress if those trading relationships are disrupted for any reason. I identify the concentration of trading partners within an industry by calculating a Herfindahl-Hirshman Index value, similar to procedures in antitrust analysis. An industry with a more concentrated set of trading partners has a Herfindahl-Hirshman Index value that is relatively higher than other industries for either import or export activity.
Chart 2 shows the share of total employment in industries highly exposed to trade with a smaller set of trading partners. Four states in the Tenth District—Kansas, Missouri, Oklahoma, and Wyoming—have a higher share of employment in these industries than the country as a whole. Specifically, these states’ higher employment in oil and gas production, transportation equipment manufacturing, or both, contribute to their higher exposure.
Chart 2: Tenth District employment in industries highly exposed to trade with a more concentrated number of trading partners
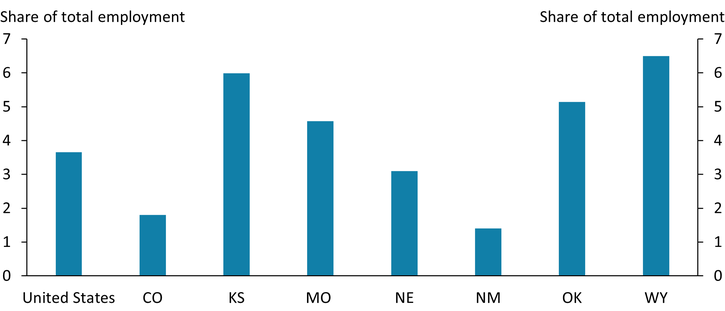
Sources: BLS (Haver Analytics), BEA, U.S. Census Bureau, and author’s calculations.
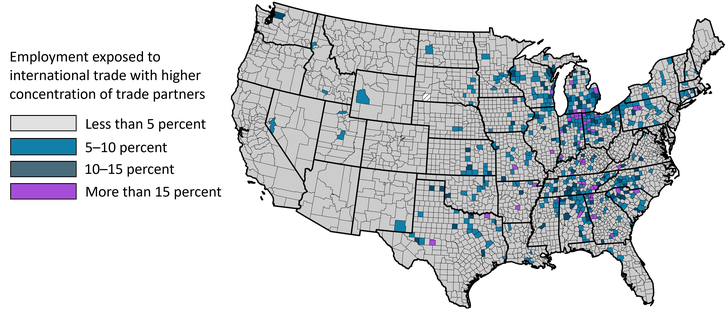
Although certain Tenth District states are more exposed to concentrated international trade, employment in exposed industries is not evenly distributed across these states. Map 1 shows that only a handful of counties in the Tenth District account for most of the employment in industries most at risk to changes in international trade. Individual counties most exposed to highly concentrated international trade tend to be in Kansas and Oklahoma, particularly in areas with transportation manufacturing in subindustries such as aerospace. After combining the estimated exposure of an industry’s inputs to imports and an industry’s products to exports with an industry’s trade partner concentration, I find that fewer counties overall are exposed to international trade than suggested by some recent estimates (Azzimonti and others 2025). However, as with other studies, estimates provided here are only an approximation given the limited direct data available at the regional level.
Map 1: Employment in industries that are both highly exposed to international trade and reliant on fewer trade partners
In aggregate, employment in the Tenth District is less exposed to international trade generally and less exposed to highly concentrated partners in particular than in some other U.S. regions. Indeed, potential outsized disruptions to employment emanating from ongoing trade policy changes—or other geopolitical events such as conflict or severe weather—are likely to be more concentrated only in specific counties of the Tenth District. Nonetheless, even “less exposed” industries have employment exposure to the risks from changes in international trade, just less so than the national average, and certain Tenth District communities, such as those concentrated in transportation manufacturing, are particularly exposed.
How could changes in international trade affect employment in pockets of the Tenth District?
Endnotes
-
1 The U.S. Census Bureau notes that both import and export data at the state level face limitations. Regarding import data, “In certain cases, the state of destination may not reflect the final location for which the imported goods are destined. Rather for these shipments, the state of destination, as known at the time the entry documentation is filed, may reflect an intermediary, storage or distribution point. From there, these shipments may later be distributed to another location in another state as the ultimate destination.” Similarly, for export data, “in certain cases, the origin of movement is not the transportation origin. Whenever shipments are consolidated, the state of origin will reflect the consolidation point. This effect is particularly noticeable for agricultural shipments.” Accordingly, researchers have measured regional exposure to international trade in alternative ways. Azzimonti and others (2025) at the Federal Reserve Bank of Richmond estimate county-level effects from changes to tariff policy but note a lack of estimates for an industry’s reliance on imports. McCoy and Kauffman (2025) build on this work by proposing an estimate for industry reliance on international trade that includes exposure to imports using U.S. Bureau of Economic Analysis (BEA) Make-Use tables.
-
2 Select goods-producing industries include farming (NAICS 111, 112); forestry, fishing, and agricultural support (NAICS 113, 114, 115); mining (NAICS 211); food and beverage manufacturing (NAICS 311, 312); textile manufacturing (NAICS 313, 314); apparel and leather product manufacturing (NAICS 315, 316); wood product manufacturing (NAICS 312); paper product manufacturing (NAICS 322); printing (NAICS 323); petroleum and coal product manufacturing (NAICS 324); plastic and rubber product manufacturing (NAICS 326); nonmetallic mineral product manufacturing (NAICS 327); primary metal manufacturing (NAICS 331); fabricated metal product manufacturing (NAICS 332); machinery manufacturing (NAICS 333); computer and electronic product manufacturing (NAICS 334); electrical equipment and appliance manufacturing (NAICS 335); transportation equipment manufacturing (NAICS 336); furniture manufacturing (NAICS 337); and miscellaneous manufacturing (NAICS 339).
Article Citation
McCoy, John. 2025. "Changes in International Trade Could Disproportionately Affect Employment in Pockets of the Tenth District." Federal Reserve Bank of Kansas City, Economic Bulletin, July 7.
References
Azzimonti, Marina, Zach Edwards, Sonya Ravindranath Waddell, and Acacia Wyckoff. 2025. “External LinkTariffs: Estimating the Economic Impact of the 2025 Measures and Proposals.” Federal Reserve Bank of Richmond, Economic Brief no. 25-12, April.
McCoy, John, and Nate Kauffman. 2025. “Labor Market Risk Associated with Trade Uncertainty More Limited in Nebraska.” Federal Reserve Bank of Kansas City, Nebraska Economist, April 18.
U.S. Census Bureau. n.d. “External LinkGuide to the U.S. International Trade Statistical Program.”
John McCoy is an associate economist at the Federal Reserve Bank of Kansas City. The views expressed are those of the author and do not reflect the positions of the Federal Reserve Bank of Kansas City or the Federal Reserve System.
Author