Consumer spending patterns shifted considerably over the past year as the pandemic altered everyday life. Employment losses, changes in income, and restrictions on activities led consumers to spend less overall as well as modify the mix of goods and services they purchased. These shifts have, in turn, affected business performance and lowered overall economic activity in the broader U.S. economy.
Chart 1 shows that consumer spending plunged during the initial stages of the pandemic, recovered somewhat in the months following, but remained below year-ago levels through 2020. In the initial stages of the pandemic, personal consumption expenditures (black line) fell by more than 10 percent as many businesses closed or reduced services and stay-at-home orders were instituted across most of the United States._ Although overall spending bounced back sharply in the second half of 2020, it remained well below year-ago levels driven by both high unemployment and health risks associated with some services such as indoor dining, travel, and large events. Accordingly, the decline in overall spending has reflected a large fall in services consumption (green line), as spending on goods (blue line) has remained robust.
Chart 1: Personal Consumption Expenditures Recovered in the Second Half of 2020, but Remained Below 2019 Levels
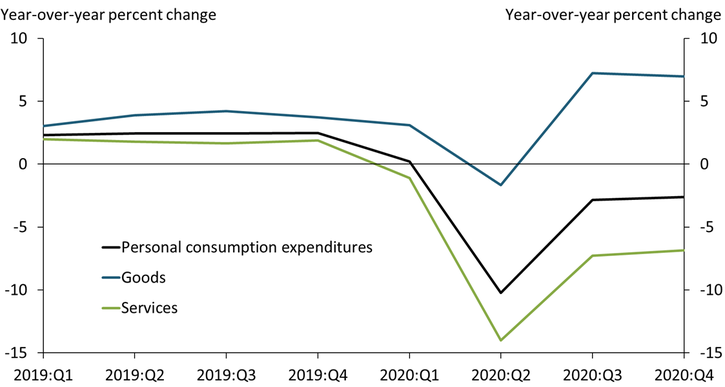
Source: Bureau of Economic Analysis (Haver Analytics).
Although these declines in consumer spending have been unprecedented, they would have been much worse without unemployment benefits and federal stimulus. The national unemployment rate jumped from 3.5 percent in February 2020 to 14.8 percent in April 2020, resulting in lost income for millions of workers. For many households, this lost income was partially or fully offset by regular unemployment benefits; enhanced unemployment benefits as part of the Coronavirus Aid, Relief, and Economic Security (CARES) Act; and one-time stimulus payments as part of the CARES Act. Chart 2 shows that even though workplace earnings (maroon bar) fell 2.4 percent compared with year-ago levels in the second quarter of 2020, total personal income (black line) rose 10.7 percent due to a large boost in receipts from government transfers (blue bar). Transfer receipts continued to support personal income in the second half of 2020, and the $900 billion stimulus package enacted at the end of 2020 should help to support income in early 2021. Given that personal income partly determines consumers’ ability to spend, Chart 2 suggests that government stimulus has played a key role in supporting consumer spending during the pandemic.
Chart 2: Government Transfers Boosted Personal Income Starting in 2020:Q2
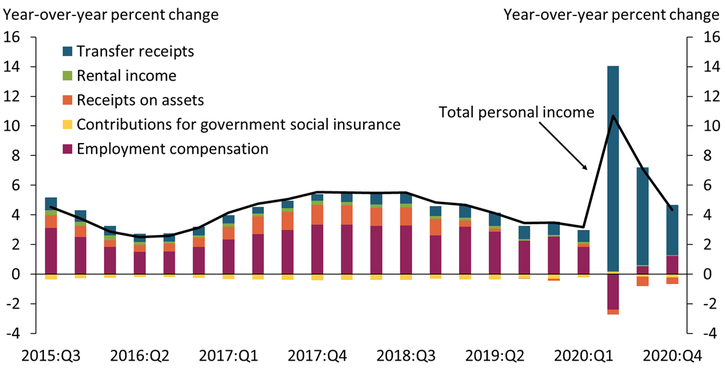
Source: Bureau of Economic Analysis (Haver Analytics).
Recent research suggests increased transfer payments did translate into higher consumer spending, especially among low-income consumers. Farrell and others (2020) show that spending rose above pre-pandemic levels for unemployed households after they started receiving unemployment benefits. In addition, Chetty and others (2020) find that consumer spending jumped significantly following stimulus payments in mid-April, with larger spending increases among low-income households. Indeed, credit and debit card data from Opportunity Insights’ Economic Tracker show that low-income households cut spending by less than high-income households during the initial stages of the recovery. Spending among low-income households reached pre-pandemic levels by early September 2020 and jumped again in early January 2021 as additional stimulus payments arrived. However, spending among high-income households still remains below a year ago.
In addition to its overall effect on consumer spending, the pandemic has also led to a dramatic shift in consumer spending patterns. As shown in Chart 1, spending on services has declined disproportionately since the pandemic began, due to health concerns associated with many services and restrictions on many businesses. However, even within the services sector, consumer spending patterns have shifted. Chart 3 shows year-over-year percent changes in real consumer spending on select services. Unsurprisingly, the greatest declines in spending were in services with heavy COVID-19 restrictions, such as foreign travel (light blue line) and motion picture theaters (light green line). Spending on related services, such as transportation, hotels and motels, and hairdressing salons and personal grooming services, also declined sharply.
Chart 3: Real Consumer Spending Declined Unevenly across Services
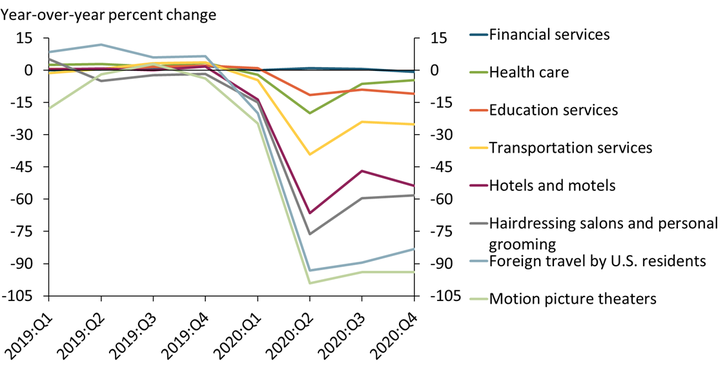
Source: Bureau of Economic Analysis (Haver Analytics).
Although spending on most services has declined during the pandemic, the declines were smaller for health-care, education, and financial services. Spending on health-care services declined by 20 percent in 2020:Q2 relative to the previous year as many U.S. hospitals canceled elective surgeries in anticipation of increased COVID-19 patients and patients canceled procedures due to concerns of exposure to the virus (Beasley 2020). Spending on educational services declined by about 11 percent over the same period, as many schools and day cares closed nationwide. Spending on financial services, unlike other categories, has remained steady during the pandemic.
Overall, consumer spending on goods fared much better than services during the pandemic, though spending varied significantly across categories. Chart 4 shows year-over-year percent changes in real consumer spending on select categories of goods. Consistent with spending more time at home, spending on games, toys, and hobbies (dark blue line); recreational goods and vehicles such as televisions, personal computers, and motorcycles (green line); and alcoholic beverages purchased for off-premises consumption (orange line) surged more than 10 percent compared with year-ago levels. Spending on furnishings (yellow line) also rose sharply during this period.
Chart 4: Real Consumer Spending Increased on Some Goods, but Declined on Others
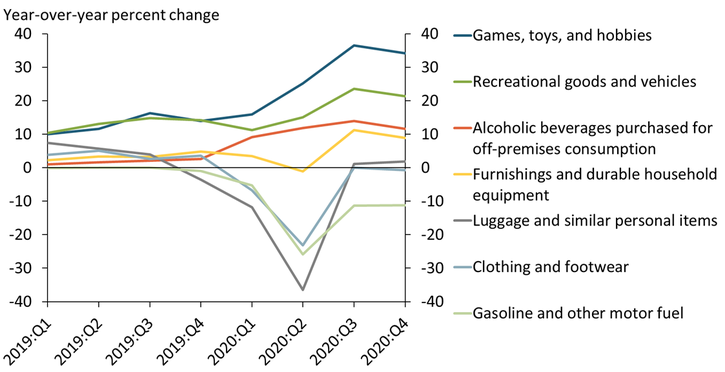
Source: Bureau of Economic Analysis (Haver Analytics).
However, consumer spending on other categories of goods declined. In particular, spending on luggage (gray line) and clothing and footwear (light blue line) declined sharply in 2020:Q2 relative to the previous year. Spending in both categories has returned to year-ago levels, perhaps due to consumers preparing for travel and social gatherings once again in response to vaccine news. In contrast, spending on gasoline and other motor fuel consumption (light green line) has remained subdued after its initial drop, likely due to many people continuing to work from home and traveling less in general.
Overall, the spread of COVID-19 and related restrictions dramatically reduced spending and altered the composition of consumer spending on goods and services. As vaccinations roll out and the country moves toward herd immunity, spending on some of the hardest-hit industries should bounce back as restrictions are lifted and consumers release their pent-up demand for some services.
Endnotes
-
1 Personal consumption expenditure (PCE) data is available from the Bureau of Economic Analysis and measures the “value of the goods and services purchased by, or on behalf of, U.S. residents.” Measures of consumer spending based on credit and debit card data (which capture a subset of all spending) show drops of more than 30 percent in early April.
References
Beasley, Deena. 2020. “External LinkU.S. Hospitals, Patients Cancel Elective Surgery as Coronavirus Spreads.” Reuters, March 16.
Chetty, Raj, John N. Friedman, Nathaniel Hendren, Michael Stepner, and The Opportunity Insights Team. 2020. “External LinkThe Economic Impacts of COVID-19: Evidence from a New Public Database Built Using Private Sector Data.” National Bureau of Economic Research, working paper no. 27431, June.
Farrell, Diana, Peter Ganong, Fiona Greig, Max Liebeskind, Pascal Noel, and Joe Vavra. 2020. “External LinkConsumption Effects of Unemployment Insurance during the COVID-19 Pandemic.” JPMorgan Chase & Co., July.
Alison Felix is a senior policy advisor at the Federal Reserve Bank of Kansas City. Samantha Shampine is a research associate at the bank. The views expressed are those of the authors and do not necessarily reflect the positions of the Federal Reserve Bank of Kansas City or the Federal Reserve System.
Author