Nebraska Employment Trends
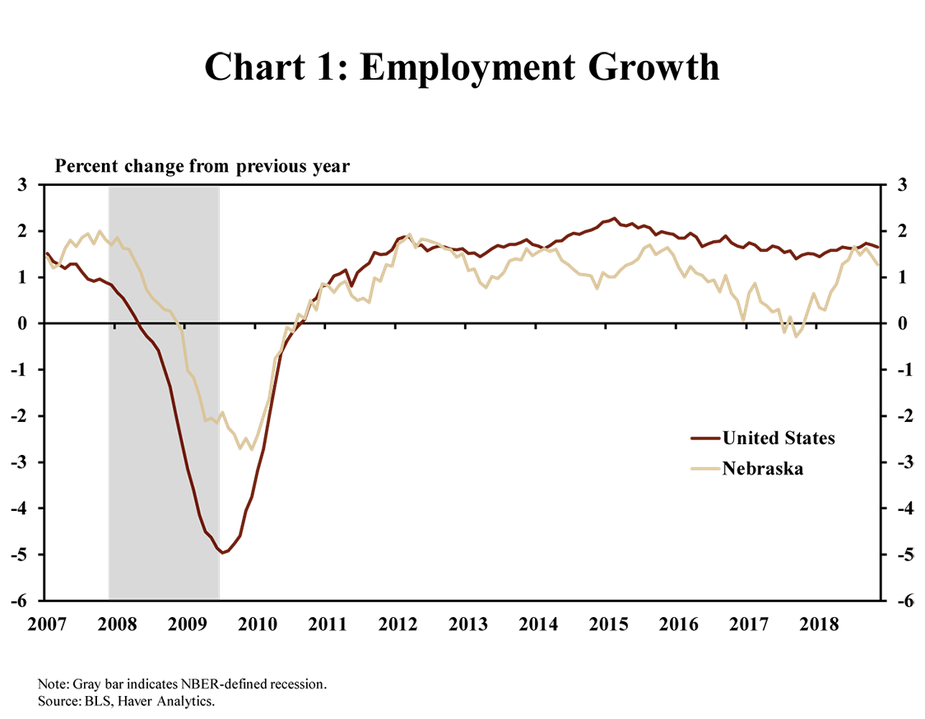
Employment growth in Nebraska accelerated in 2018 and remained relatively steady through the end of the year. After slowing in 2017, job growth through November 2018 increased, on average, 1.1 percent a month (Chart 1). Moreover, the average growth rate in the second half of 2018 was 1.5 percent, near Nebraska’s post-recession highs.
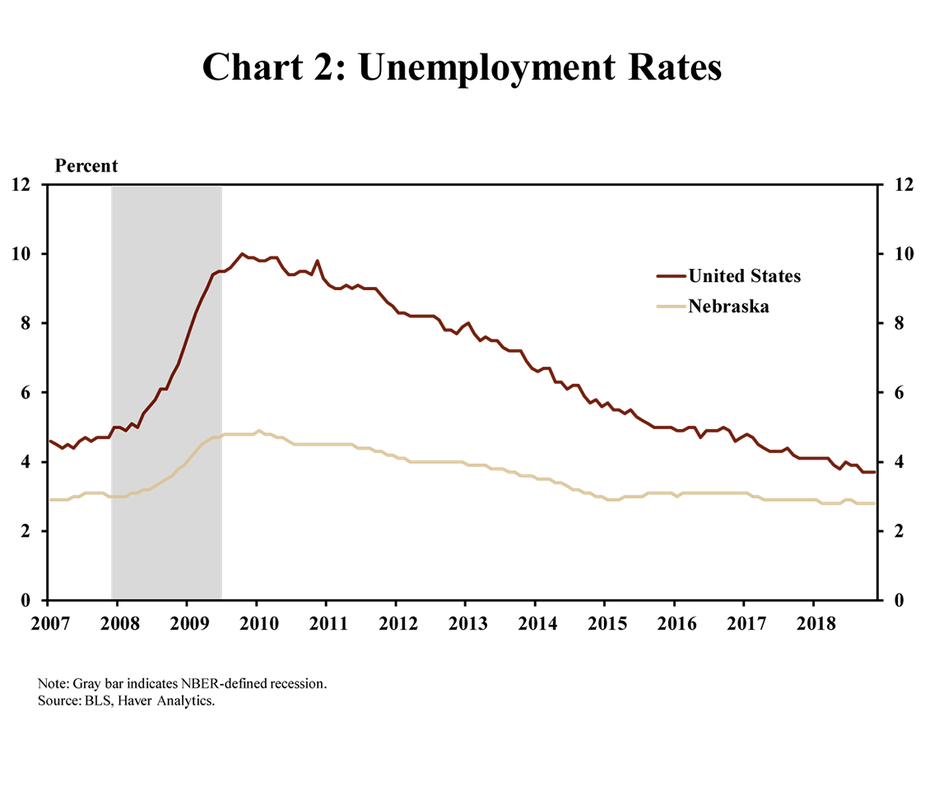
With the ongoing increases in hiring, Nebraska’s unemployment rate remained historically low. Unemployment throughout 2018 remained less than 3 percent, reaching 2.8 percent through November (Chart 2). The state’s unemployment rate also remained one of the lowest in the country, only 0.4 percentage point higher than Hawaii and Iowa, which tied for the lowest mark (Chart 3).

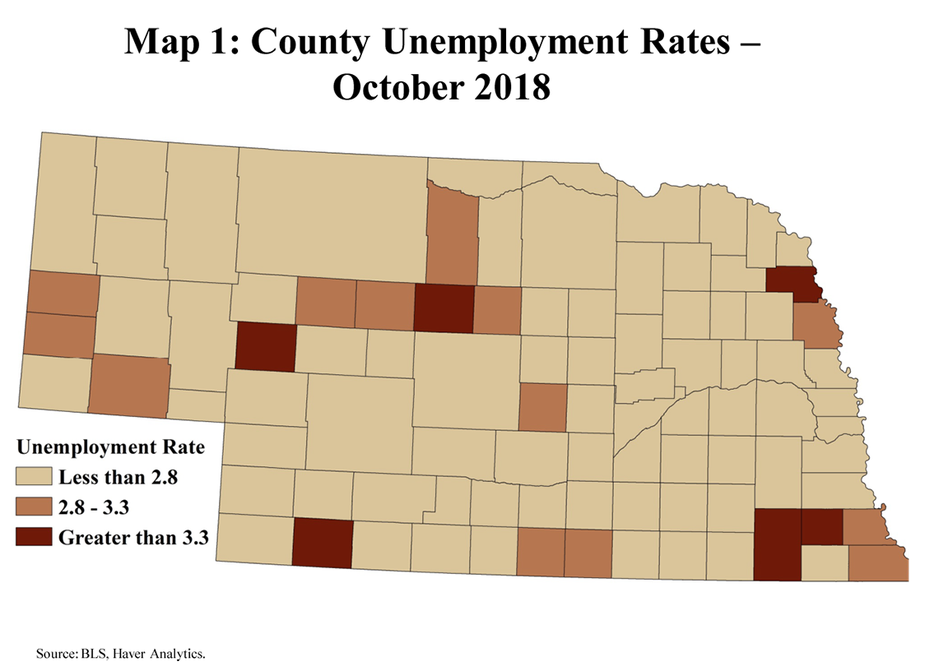
Consistent with state-level trends, unemployment rates throughout the state remained low. As of October, the latest month of available data, most counties in Nebraska posted an unemployment rate lower than the state’s average of 2.8 percent (Map 1). In fact, only six counties had an unemployment rate more than 0.5 percentage point greater than the state average. Meanwhile, employers throughout the state have continued to comment on persistent labor shortages.
Metropolitan Job Growth
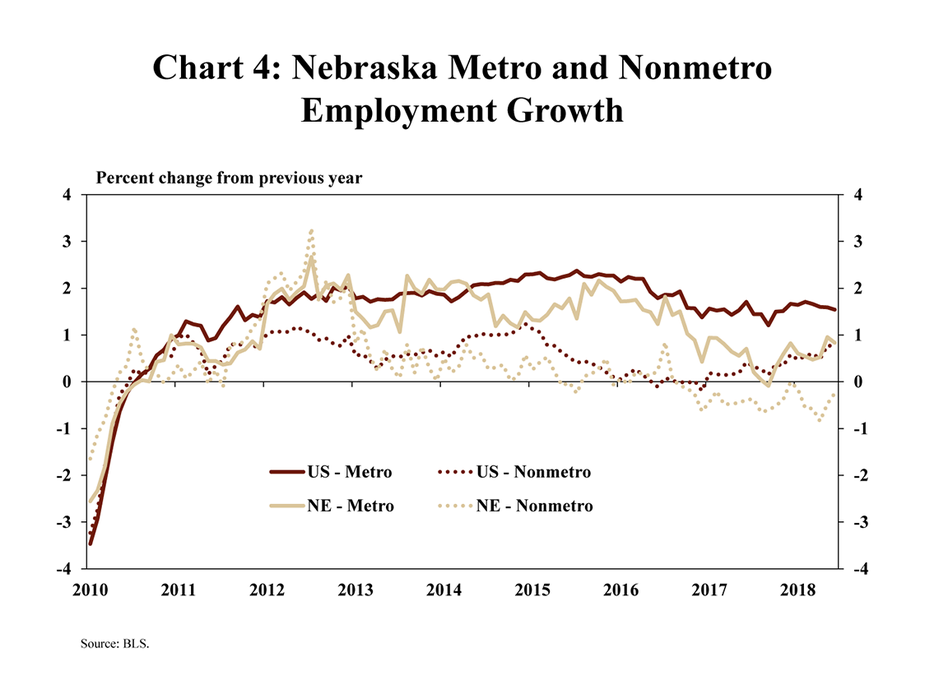
Similar to recent trends in employment, job gains have continued to be strongest in the state’s metropolitan areas. About five years ago, beginning in early 2013, the rate of job growth in Nebraska’s nonmetro areas began to weaken relative to the steady growth in metro areas, specifically Omaha and Lincoln (Chart 4). The gap between metro and nonmetro employment growth reached its widest mark in 2015, with an average difference of more than 1.5 percentage points. Since 2015, the gap has narrowed slightly, but job growth in nonmetro areas has remained negative for the past two years.
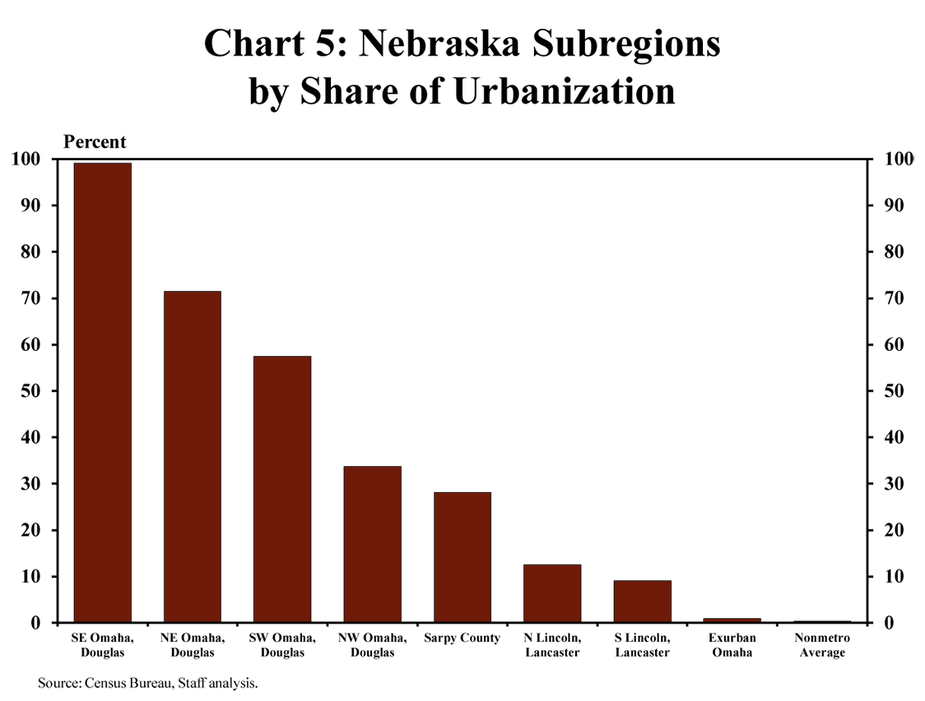
Much of the state’s job growth in recent years has been concentrated in Omaha and Lincoln. A closer look at these metro areas shows how the extent of urbanization has affected job growth. Using American Community Survey (ACS) data from the U.S. Census Bureau (see footnote), Nebraska’s metro and nonmetro areas can be divided into subregions, each comprising about 100,000 residents to allow for comparison while holding population levels constant (Map 2). The extent of urbanization across these subregions ranges from nearly 100 percent in southeast Douglas County to near zero outside Omaha and Lincoln (Chart 5).
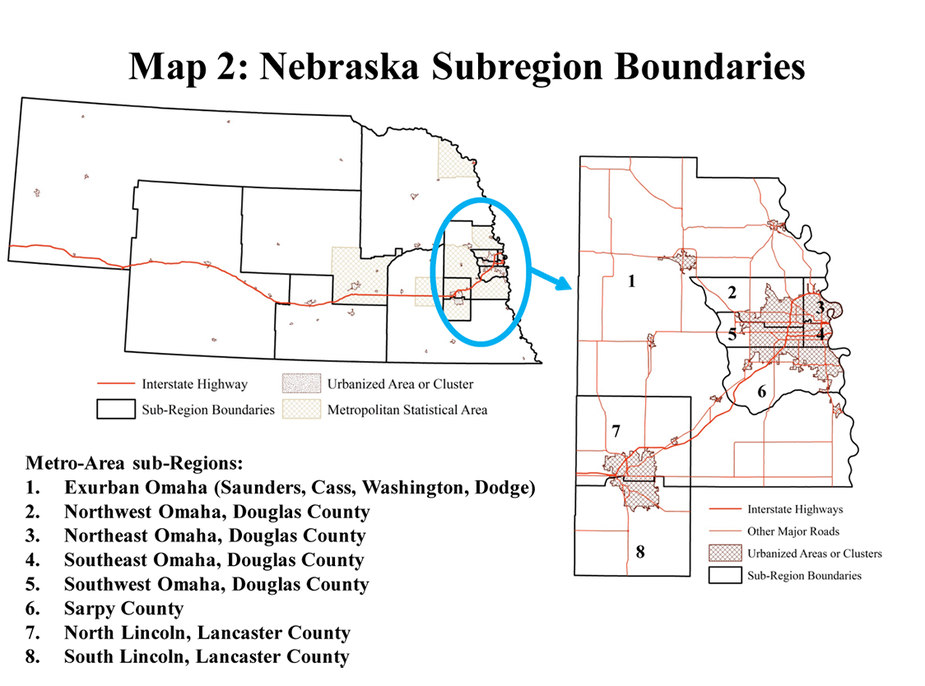
Although job growth in Nebraska largely has occurred in the state’s metro areas, growth has been strongest among residents of subregions that are only partly urbanized. ACS data indicates employment growth from 2012 through 2017 was strongest in southwest Douglas County in Omaha, averaging nearly 4 percent (Chart 6). This includes all of Douglas County south of Pacific Street and west of 72nd Street. Job gains also were strong in Sarpy County and other metro regions outside of the city center (southeast Douglas County, south of Dodge Street and east of 72nd Street). Consistent with statewide trends, employment growth in nonmetro areas with very little urbanization was relatively weak.

Nebraska Employment by Industry
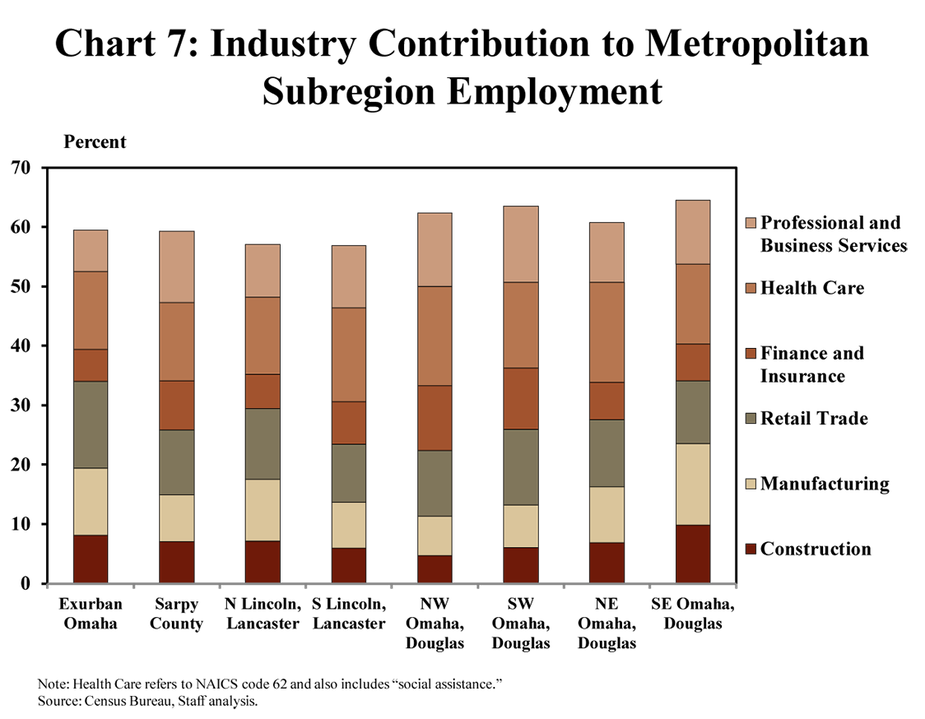
As specific regions within Nebraska’s metro areas have continued to grow, several industries in those regions have accounted for a majority of jobs. Through 2017, employment in professional and business services, health care and social assistance, finance and insurance, retail trade, manufacturing and construction accounted for more than 60 percent across the Omaha and Lincoln metro areas (Chart 7). Health care has accounted for the largest share of jobs in most of the state’s metro subregions, employing about 15 percent of residents, on average.
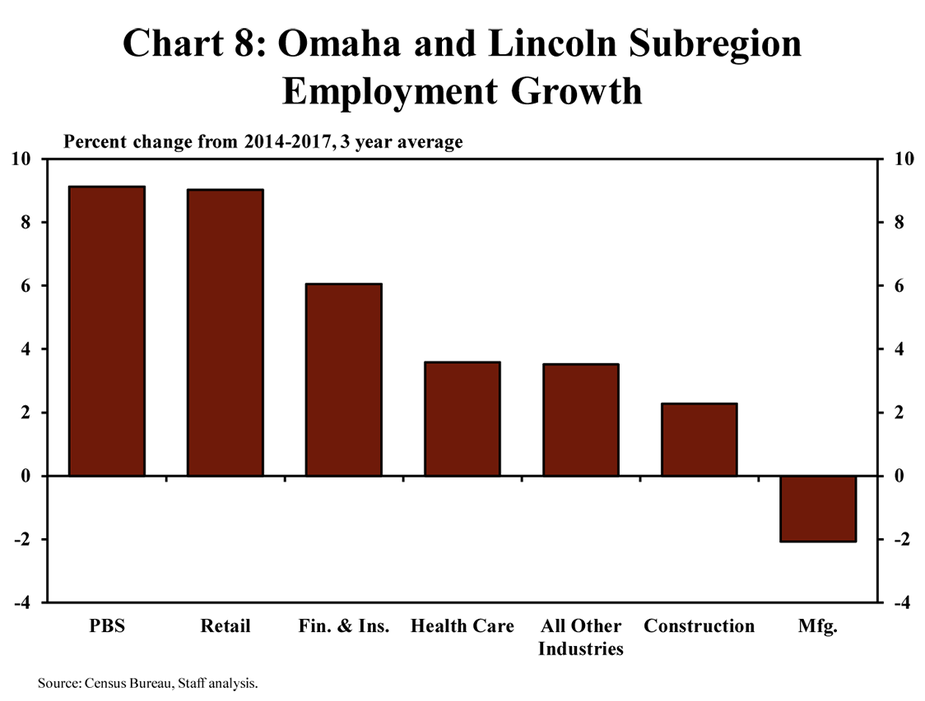
The composition of Nebraska’s workforce in its metro areas has shifted, however, alongside recent job growth in these industries. In the five years from 2012 to 2017, employment at professional and business service firms in Omaha and Lincoln increased about 9 percent, on average, with similar gains in retail employment (Chart 8). With the exception of manufacturing, which experienced several years of decline before increasing since 2017, most other major industries added jobs at a solid pace across the metro areas of Omaha and Lincoln.
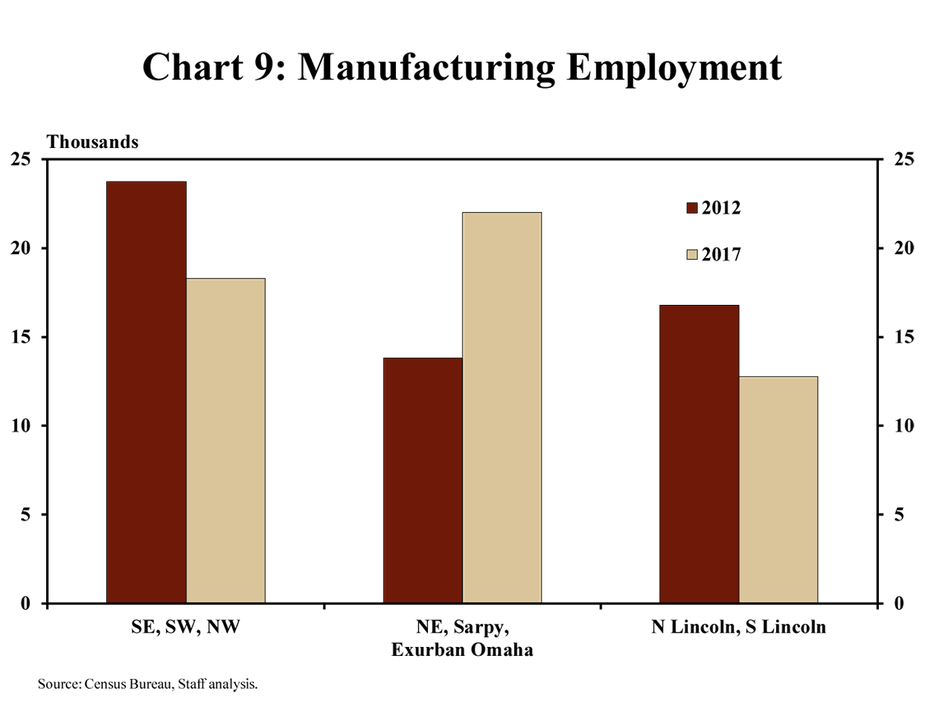
Manufacturing employment in Omaha and Lincoln shifted notably from 2012 through 2017. In Lincoln, manufacturing employment decreased about 25 percent during that time (Chart 9). The largest declines in Lincoln’s manufacturing employment were in north Lancaster County, which employs a relatively large number of residents in the industry. In Omaha, the number of individuals employed at manufacturing firms and residing in southeast, southwest and northwest Douglas County also decreased nearly 25 percent from 2012 to 2017. However, increases in manufacturing jobs in other regions within the Omaha metro area, primarily outside of Douglas County, more than offset these declines.
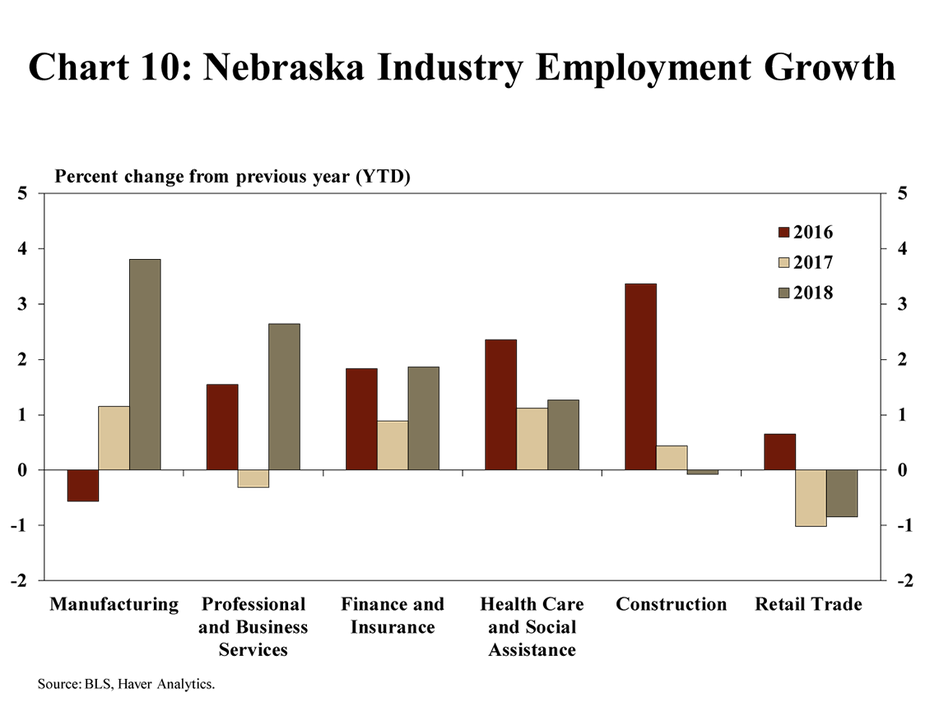
Since 2017, most of the major industries concentrated in Nebraska’s metro areas have continued to add jobs at a solid pace, and manufacturing employment has increased significantly. In 2018, employment in manufacturing increased about 4 percent from a year ago, following modest gains in 2017 (Chart 10). Employment gains at professional and business service firms, finance and insurance companies and in health care also contributed significantly to robust job growth in Nebraska in 2018. Among these six major industries, only the retail sector has experienced modest job losses in each of the past two years.
Conclusion
Heading into 2019, Nebraska’s labor market appears well positioned to remain strong, driven by steady employment gains in Omaha’s suburbs and surrounding metro regions. Unemployment also has remained low in downtown Omaha, but job growth there has been more limited in recent years. Although unemployment rates also are likely to remain low in rural parts of the state, job growth appears likely to remain muted in those areas alongside persistent weakness in the agricultural sector and steady population loss. Most notably, however, a strong rebound in manufacturing employment in 2018 and steady gains in other major industries highlight a positive outlook for Nebraska’s labor market for the coming year.
The American Community Survey is a survey of U.S. households administered annually by the U.S. Census Bureau, gathering a wide range of information about local areas. Annual data for the previous year are made available in September, and regions within each state comprising about 100,000 people are constructed using counties and/or census tracts. These regions are referred to as Public Use Microdata Areas or PUMAs. In densely populated areas, a PUMA may be smaller in geographic size than the county that covers the same area. In contrast, in sparsely populated areas, a PUMA may be an aggregation of several counties. PUMA boundaries are defined using the decennial census and the current boundaries used in this article have been in effect since 2012.
The views expressed in this article are those of the authors and do not necessarily reflect the views of the Federal Reserve Bank of Kansas City or the Federal Reserve System.
Author