Much of Nebraska’s economy has recovered from the pandemic, but the pandemic also exacerbated a gap in job growth between the state’s strongest and weakest industries that already existed in 2019. Disparities in employment growth between the strongest and weakest industries have widened throughout the country. This widening gap in job growth across industries, however, has varied across states and between metro and nonmetro areas within states. The trend has been especially pronounced in rural Nebraska, where industries that added jobs at the strongest pace during the pandemic were also adding jobs at a much stronger pace before the pandemic. Despite the differences in job growth though, wages have grown robustly in almost all industries.
Nebraska’s Job Market Recovery
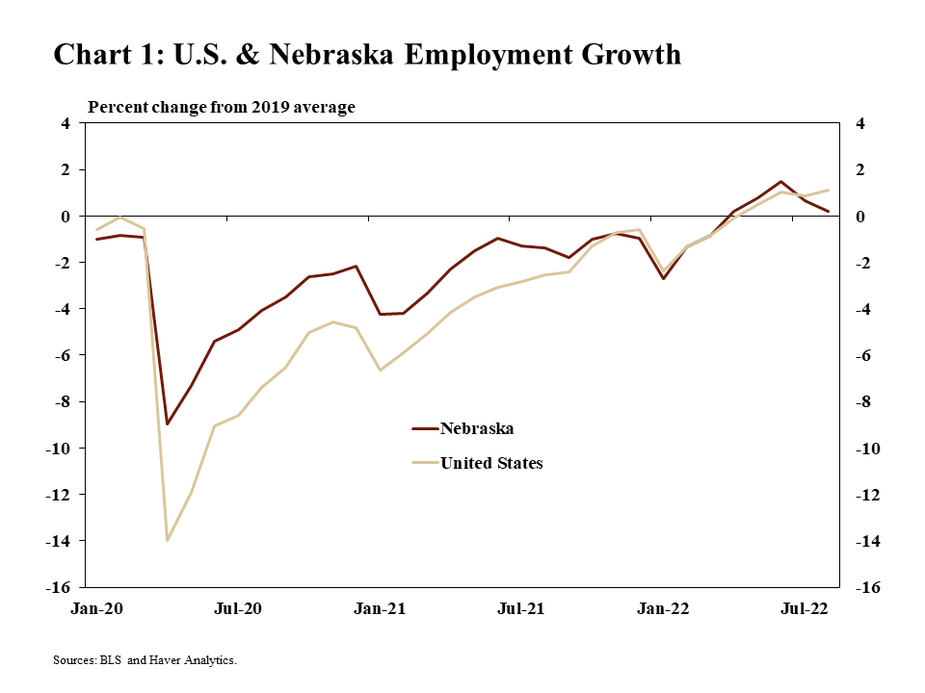
The number of jobs in both Nebraska and the United States has exceeded pre-pandemic levels since April 2022. As of August, employment in Nebraska was 0.2 percent higher than in 2019 despite a modest decline from the previous month (Chart 1). Early in the pandemic, job losses in Nebraska were less than the nation and employment rebounded more quickly. Since the fall of 2021, however, both Nebraska and the United States have added jobs at about the same rate of 0.25% per month.
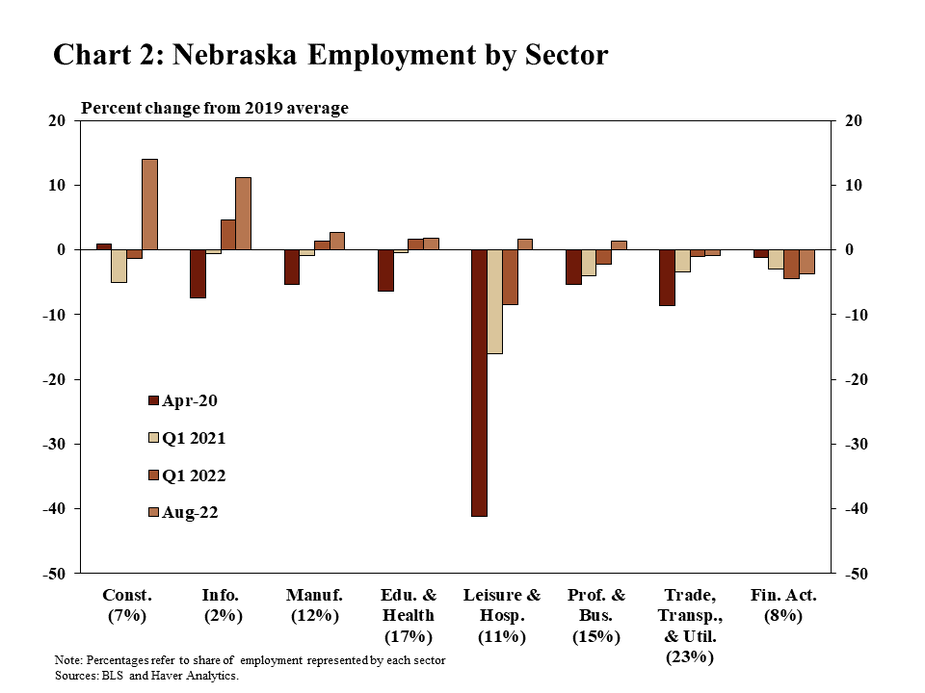
For most sectors, labor markets did not fully recover until early 2022. Following the initial extreme job losses of the pandemic, most sectors recovered incrementally in the months that followed (Chart 2). Only trade, transportation, and utilities and financial activities remained below their 2019 levels as of August 2022.
Existing Gap in Job Growth Widened During the Pandemic
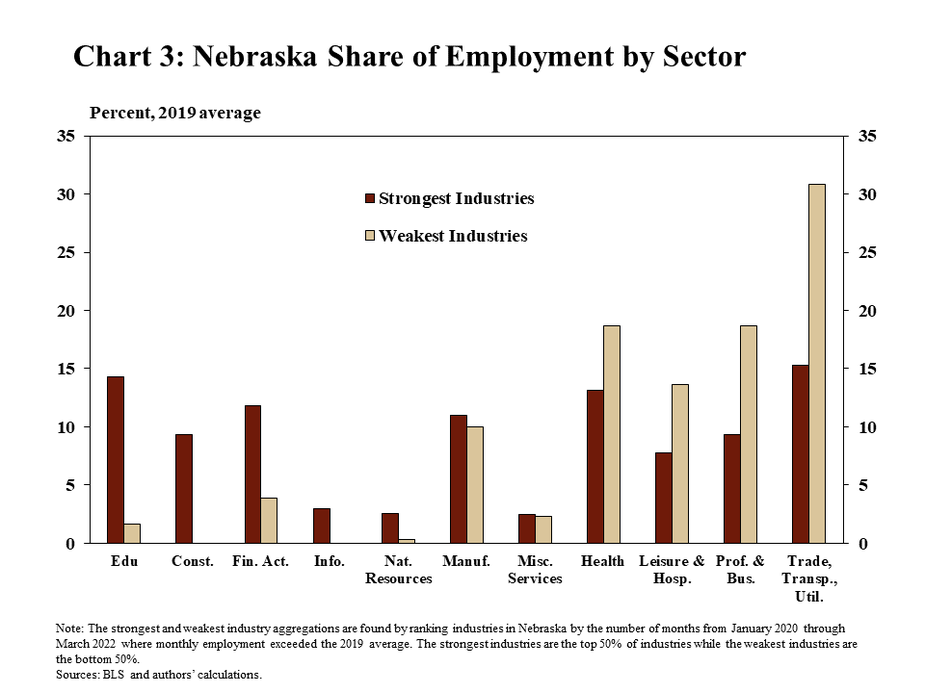
Since 2020, industries with the weakest job growth tended to be in economic sectors most directly exposed to restrictions associated with the pandemic. Of the sectors that added jobs most slowly in the wake of the pandemic, a few were especially prominent. Industries in the leisure and hospitality sector, such as hotels, full-service restaurants, daycare centers, and drycleaners ranked among the weakest industries during the pandemic, in addition to retail trade (Chart 3). In contrast, those with the strongest job growth_ tended to be industries that were deemed essential, were well suited to operate alongside public health restrictions, or benefited from a surge in demand because of the pandemic. For example, essential industries like food manufacturing added jobs during the pandemic, as did construction businesses that were able to operate despite public health restrictions that affected other industries.
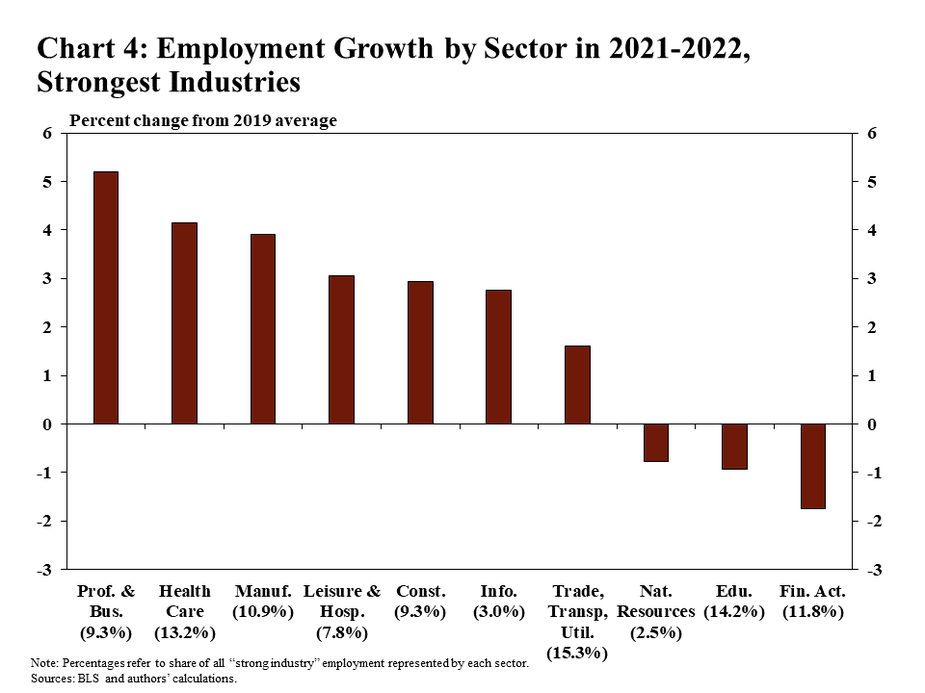
While employment in Nebraska remained less than its pre-pandemic level in 2021 and early 2022, some industries grew much faster than others. In fact, employment in the strongest industries was 2.1% higher in 2021 and 2022 than in 2019. Moreover, many of the strongest industries added jobs even as employment declined in the sector overall. For example, employment in the professional and business services sector was 2 percent less than pre-pandemic levels by the first quarter of 2022. However, employment in some industries within that sector – such as legal services, computer systems design, and accounting services – increased by more than 5% relative to 2019 (Chart 4).
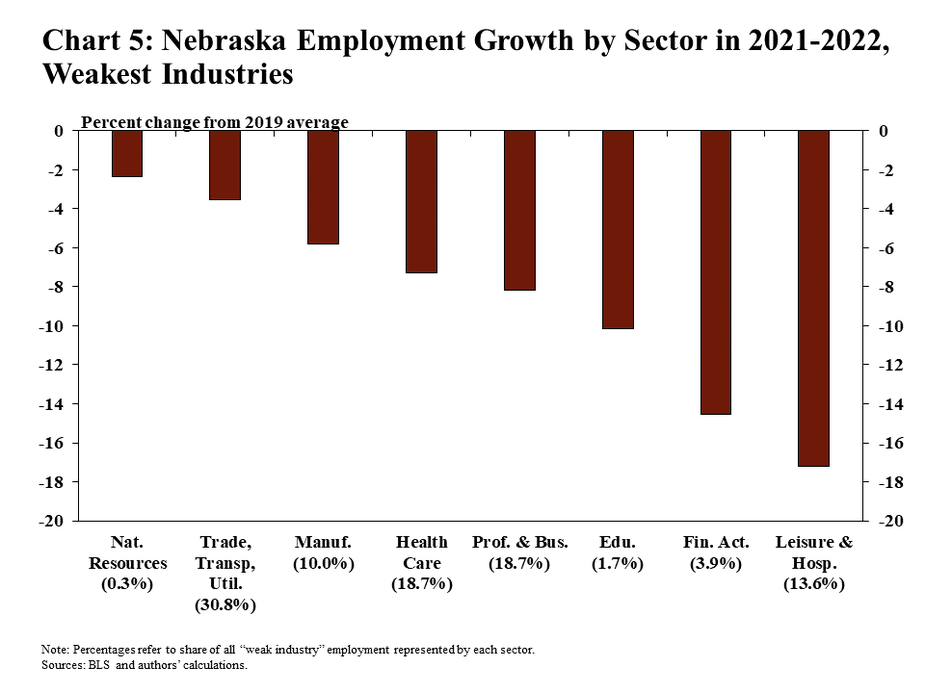
In contrast, employment in Nebraska’s weakest industries has remained well below pre-pandemic levels. In 2021 and 2022, on average, employment in the weakest industries was nearly 8 percent less than in 2019. Industries in the leisure and hospitality sector were most heavily impacted, with employment in the weakest industries in that sector still nearly 20% less than 2019 (Chart 5). In particular, the number of people working at hotels and full-service restaurants has remained 22% and 14% less than 2019, respectively.
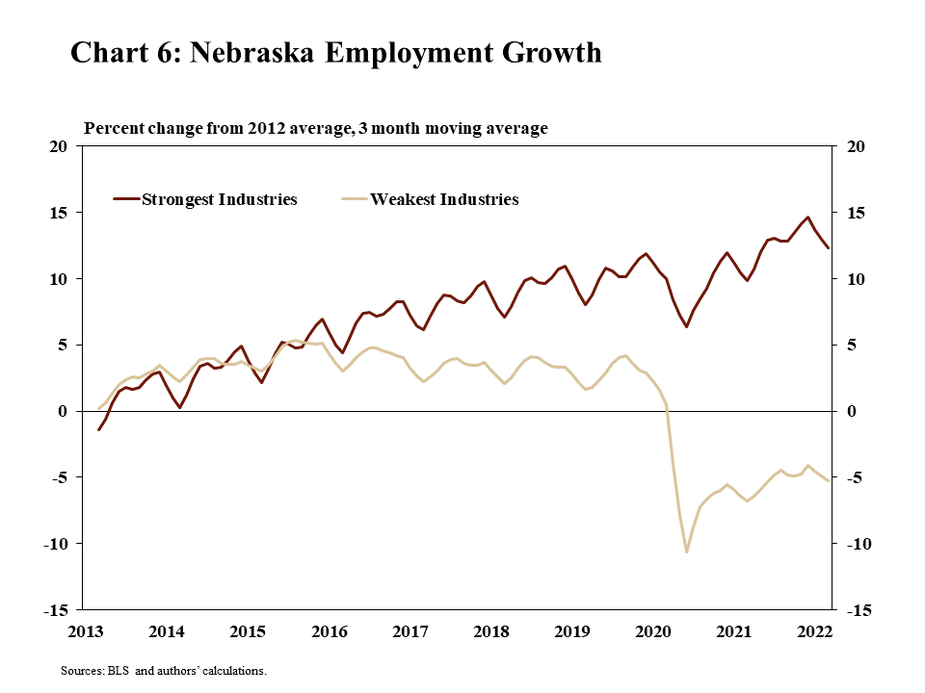
Despite the significant and varying effects of the pandemic, industries that have added jobs at the fastest pace since 2020 generally were the same industries that were growing at a faster pace even before the pandemic. The rate of job growth in industries categorized as Nebraska’s strongest or weakest, based on growth during the pandemic, actually began to diverge as early as 2015. Prior to 2015, employment was increasing at a rate of about 0.25% per month across both sets of industries. From 2015 to 2019, however, industries that (later) added jobs at a faster pace during the pandemic were already growing 9 percentage points faster by the end of 2019, before the pandemic (Chart 6).
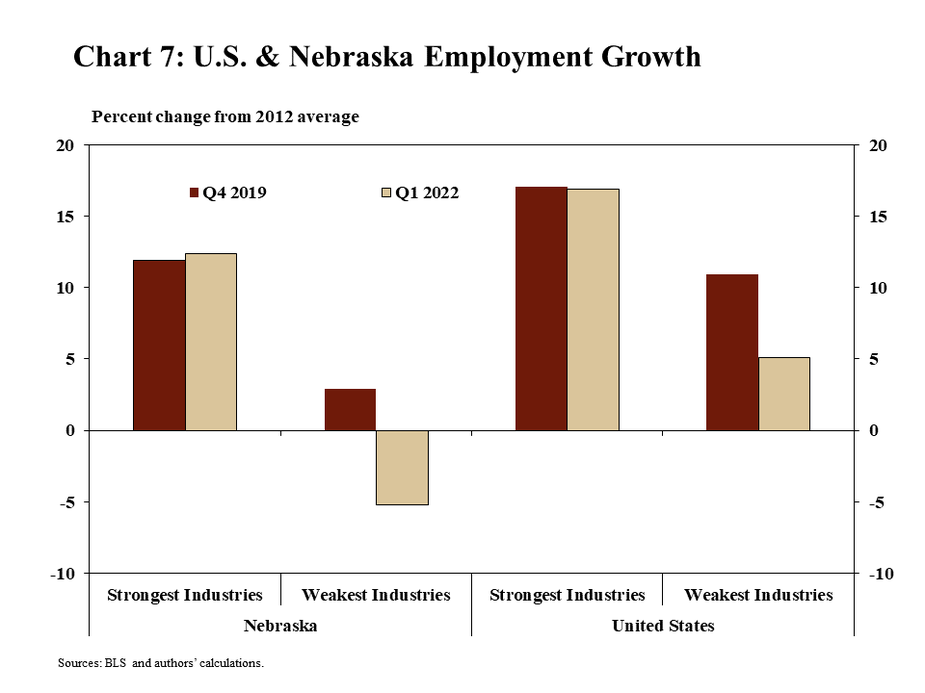
In fact, the gap in job growth between the strongest and weakest industries widened during the pandemic in both Nebraska and the United States. From 2012 to 2019, employment in Nebraska’s industries that were strongest during the pandemic had increased by 11.9% (Chart 7). By 2022, employment in these industries increased further, to 12.3% higher than in 2012. In contrast, employment in Nebraska’ industries that were weakest during the pandemic had only increased by 2.9% from 2012 to 2019 and, by early 2022, dropped to 5.2% less than 2012 by early 2022.
Widening Disparity in Employment Growth Across Geographies
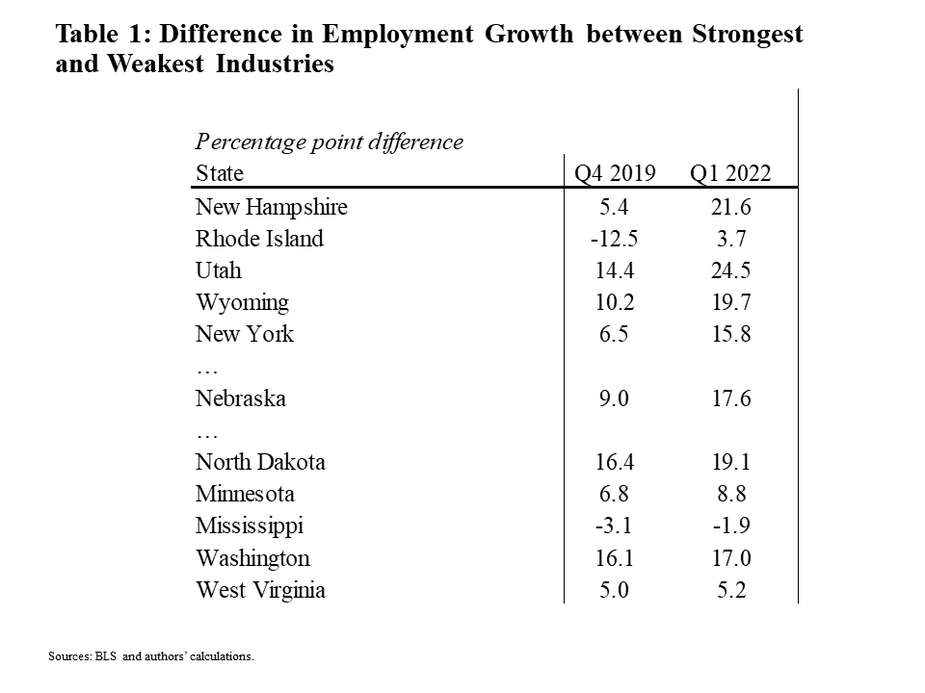
The widening gap in job growth between the strongest and weakest industries was more pronounced in Nebraska than many other states. In several states, the gap in employment growth between the strongest and weakest industries increased by more than 10 percentage points from 2019 to 2022. In Nebraska, this gap widened at the 8th fastest pace when compared to all states from 9.0% in 2019 to 17.6% in 2022 (Table 1).
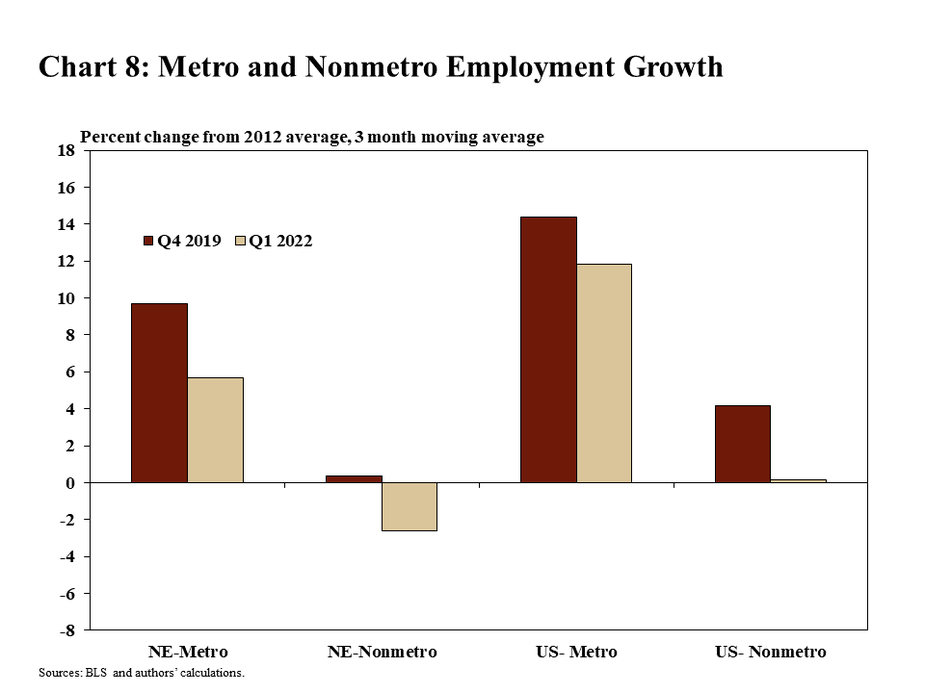
In addition, the pandemic appears to have further widened an existing gap in job growth between metro and nonmetro areas throughout the country. From 2012 to 2019, employment in metro areas increased by about 14% and 10% in the U.S. and Nebraska, respectively (Chart 8). In nonmetro areas, job growth during that time was only 4% in the U.S. and 0.3% in Nebraska. This gap between growth in metro areas and nonmetro areas in the U.S., when compared to 2012, widened from 10.2% in 2019 to 11.7% in early 2022. In Nebraska, the gap declined slightly between 2019 and 2022 from 9.4% in 2019 to 8.3% in 2022.
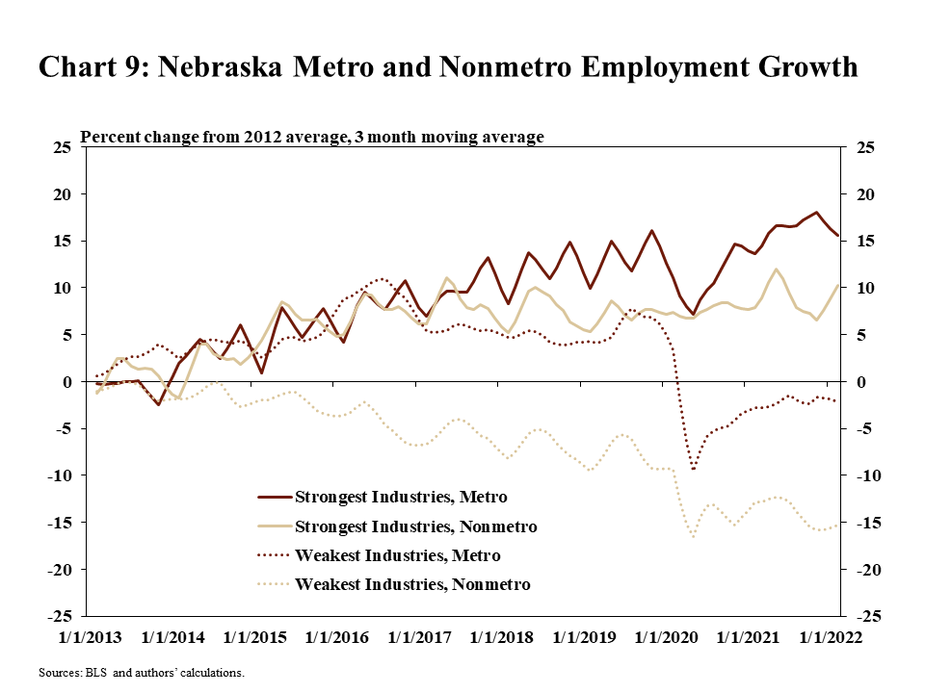
The strength of some industries in rural areas during the pandemic limited the widening disparity between job growth in metro areas and nonmetro areas that was prevalent before the pandemic. In much of nonmetro Nebraska, industries with the weakest job growth during the pandemic had also been losing jobs for many years prior to the pandemic. From 2012 to 2019, employment in these industries fell by 9.3% (Chart 9). In contrast, industries in those nonmetro areas that were most stable prior to 2020 generally were also the same industries that were the strongest during the pandemic.
Wage Growth Strong for All Industries
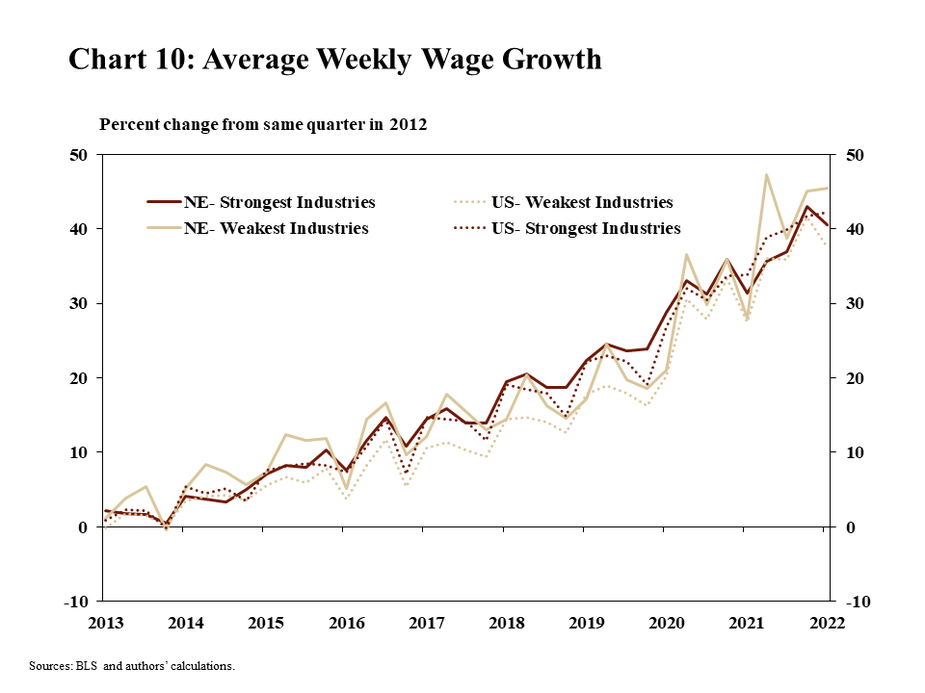
Despite significant variation in job growth among the strongest and weakest industries during the pandemic, wages have increased sharply in all industries. Since 2012, wages have increased by an average of at least 4 percent per year across all industries (Chart 10). Persistent labor shortages likely supported wage growth prior to 2020 and, in the following years, boosted earnings further in most industries and occupations. In some cases, it is possible that industries with the weakest job gains during the pandemic actually grew most slowly because of a lack of labor availability.
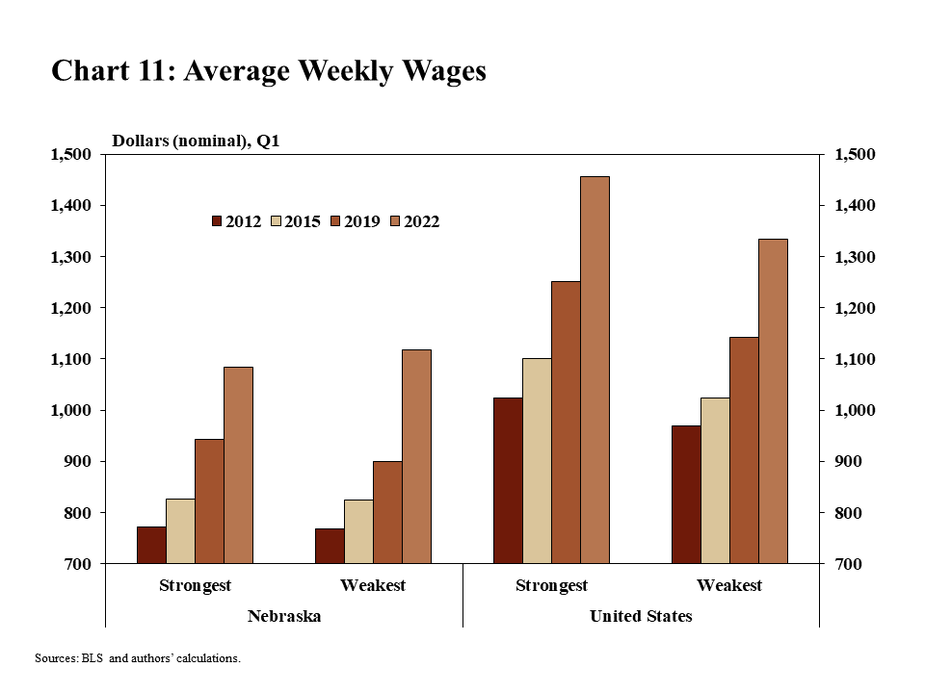
In fact, in 2022 wage gains in industries with the weakest job growth during the pandemic have exceeded those with the strongest job growth. From 2019 to 2022, wages increased from $943 per week to $1,083 per week in industries with the largest increases in employment, an increase of nearly 15 percent (Chart 11). In contrast, wages among industries with the weakest job growth during the pandemic increased by more than 24 percent, suggesting that intensifying labor shortages may have contributed to the limited increases in employment in those industries both before and during the pandemic.
Conclusion
The pandemic further widened the gap in employment growth between the strongest and weakest industries in Nebraska. While labor markets generally have recovered from the depths of the pandemic, this recovery has mostly been due to consistent job growth in industries that were adding jobs at a faster pace before the pandemic.. However, the strength of wage gains across industries suggests that some weaker industries may be constrained by labor shortages. For example, truck transportation is one of the weaker industries in the state, but has struggled attracting workers for years, even before the onset of the pandemic. Moving forward, some of the weakest industries will likely continue to lose jobs. However, other industries may begin adding jobs again should the supply of labor expand in coming months and years.
Endnotes
-
1 The strongest and weakest industry aggregations are found by ranking sub-industries in Nebraska by the number of months from January 2020 through March 2022 where monthly employment exceeded the 2019 average. The strongest industries are the top 50% of sub-industries while the weakest industries are the bottom 50%.
The views expressed are those of the authors and do not necessarily reflect the positions of the Federal Reserve Bank of Kansas City or the Federal Reserve System.
Authors

Nate Kauffman
Senior Vice President, Economist, and Omaha Branch Executive; Executive Director of the Center for Agriculture and the Economy

John McCoy
Associate Economist