Throughout the crisis and recession, Nebraska’s economy has outperformed that of many other states and the nation as a whole. A year ago, economies across the globe were devastated by the intensifying pandemic and corresponding business closures. Despite the severe effects associated with the pandemic, economic conditions in Nebraska have remained more stable throughout the crisis in a pattern that has resembled other recent recessions.

Nebraska’s Economy in Recent Recessions

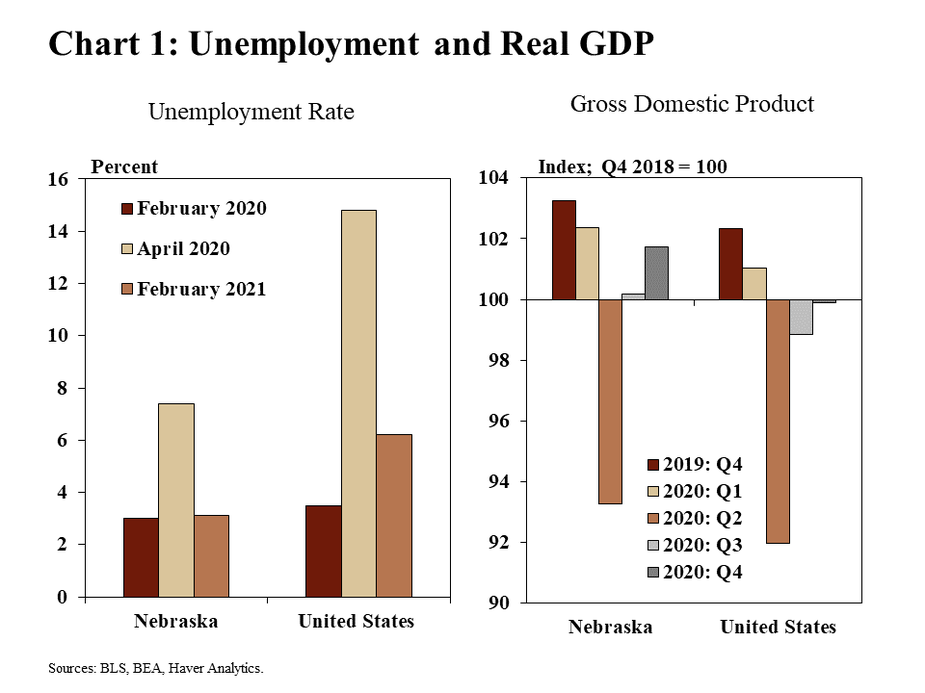
The pandemic shocked Nebraska’s economy, but some indicators have returned to pre-pandemic strength relatively quickly. Entering 2020, Nebraska’s unemployment rate was just 3% and GDP was poised to continue a steady upward path (Chart 1). By April, at the worst of the pandemic, the state’s unemployment rate peaked at 7.4% alongside an 8.9% drop in real GDP from the previous quarter. Whereas national economic indicators have been slower to recover, unemployment in Nebraska has retreated toward 3%, and GDP was within 1.5% of its record high by the end of 2020.

Chart 1: Unemployment and Real GDP are two bar charts showing unemployment rates and real GDP for Nebraska and the United States. Unemployment rates are shown for February 2020, April 2020, and February 2021. GDP is indexed to the fourth quarter of 2018 and shown for Q4 2019 and each quarter of 2020. Data sources are the BLS, BEA, and Haver Analytics.

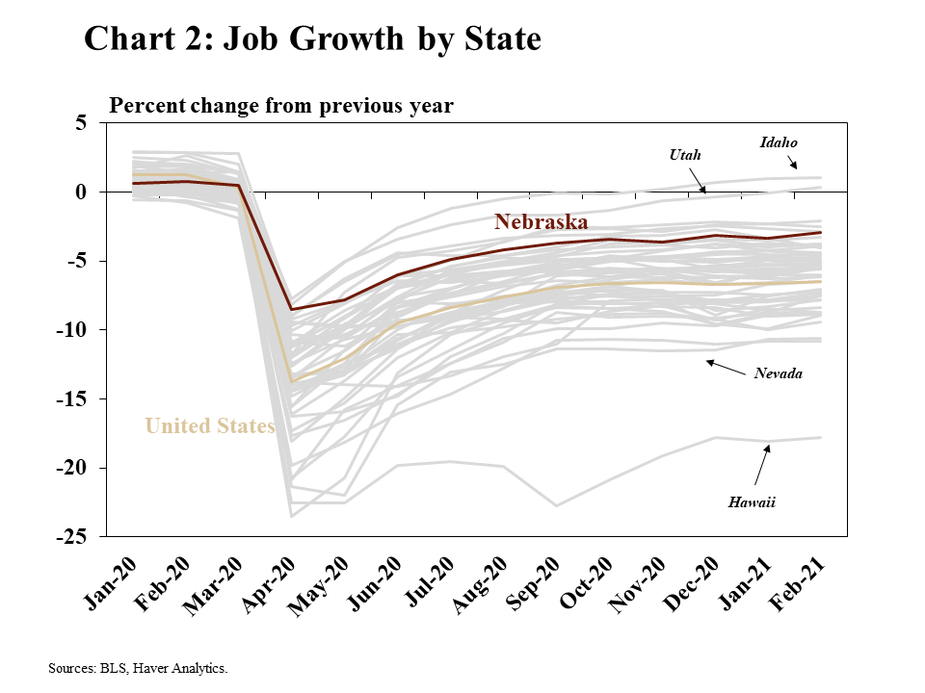
Despite the severity of the shock, job losses in Nebraska were smaller than in many other states. Prior to the pandemic, most states were adding jobs at a fairly steady pace. As the pandemic and economic contraction intensified, employment dropped sharply (Chart 2). However, the pace of job losses in Nebraska consistently has been less severe than most other states. In fact, by February 2021, employment had returned nearly to that of the previous year while employment in most other states remained more than 5% less than a year ago.

Chart 2: Job Growth by State shows lines of year-over-year job growth for each of the 50 states. The chart begins in January 2020 and ends in February 2021. Nebraska and the United States are highlighted as are the top two and bottom two states. The top two states are Idaho and Utah while the bottom two states are Hawaii and Nevada. Data sources are the BLS and Haver Analytics.

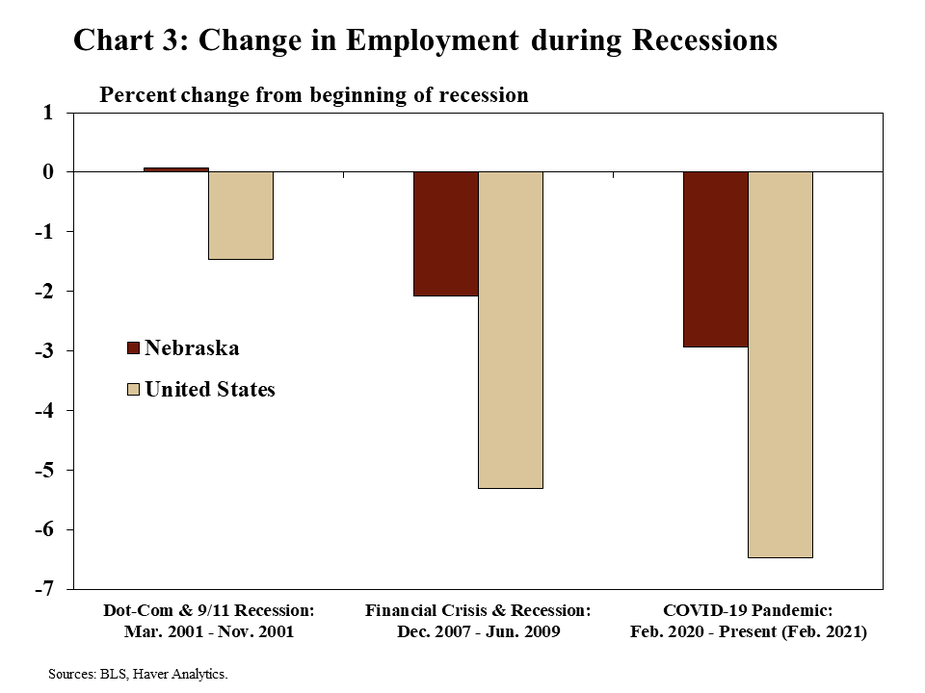
Similar to other recent recessions, employment in Nebraska has held up better than in the nation as a whole. In each of the past three recessions, job losses in Nebraska were less than half that of the nation (Chart 3). While the causes and circumstances of the current crisis have been markedly different from previous recessions, the pattern has been similar when comparing Nebraska with national averages.

Chart 3: Change in Employment during Recessions is a bar chart that shows how employment changed during recessionary periods for Nebraska and the United States. The bars show the percent change in employment from the beginning of each recession to the end. The first recession is the Dot-Com and 9/11 recession (March 2001 through November 2001). The second recession is the Financial Crisis and recession (December 2007 through June 2009). The third recession is the COVID-19 pandemic (February 2020 through the present – February 2021 on this chart). Data sources are the BLS and Haver Analytics.

Urban and Rural Comparisons

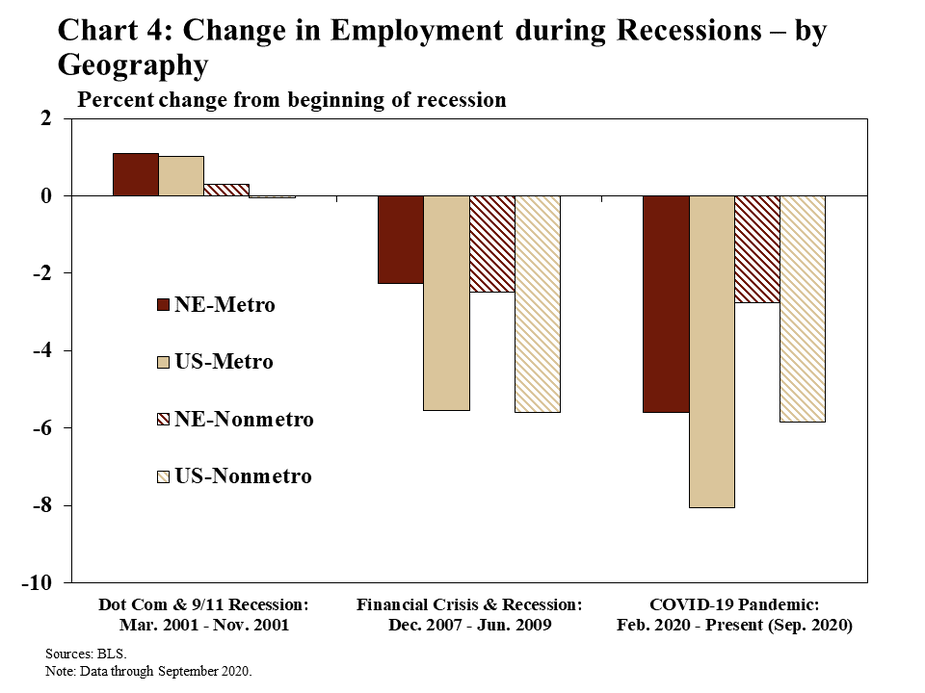
In the past three recessions of the 2000s, job losses have been more limited in both urban and rural locations in Nebraska. Compared with the previous downturn, the Great Recession of 2007-09, the pandemic has hit employment in metro areas especially hard, while job losses in rural areas have been more subdued (Chart 4). In Nebraska, rural employment declined just 2.8% from the onset of the pandemic through September (the latest local data currently available) compared with 5.8% nationally, a pattern similar to the previous recession. Although job losses in the state’s metro areas exceeded those of rural areas, the decline in Nebraska has been much less than the nation overall.

Chart 4: Change in Employment during Recessions by Geography is a bar chart that shows how employment changed during recessionary periods for metro and nonmetro areas in Nebraska and the United States. The bars show the percent change in employment from the beginning of each recession to the end. The first recession is the Dot-Com and 9/11 recession (March 2001 through November 2001). The second recession is the Financial Crisis and recession (December 2007 through June 2009). The third recession is the COVID-19 pandemic (February 2020 through the present – September 2020 on this chart). The data source is the BLS.

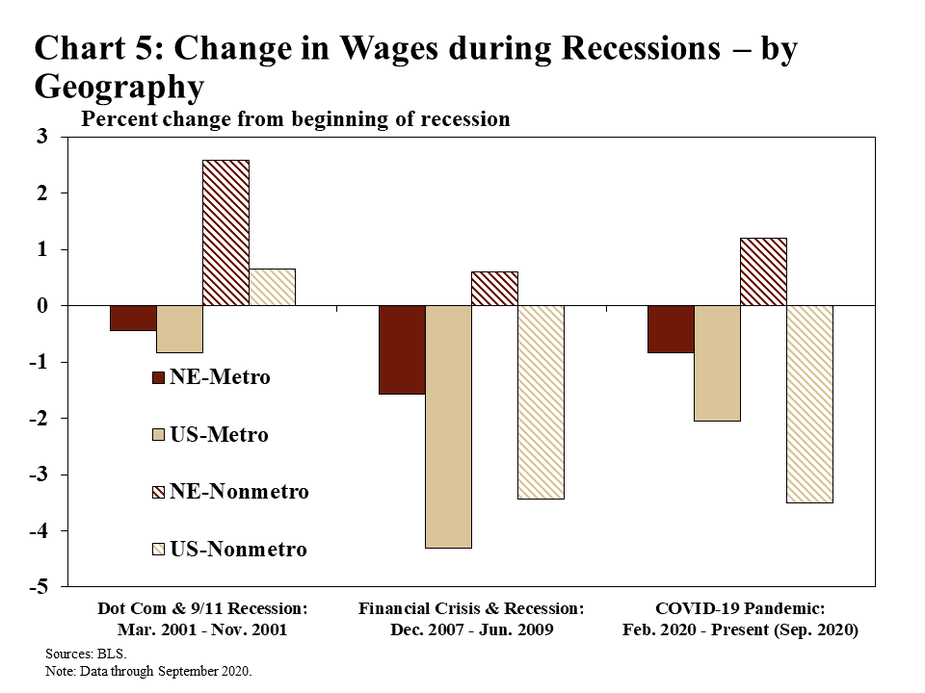
In addition, wages from employment have remained steadier throughout the state. In each recession of the 2000s, wages earned from employment in Nebraska’s rural areas continued to rise despite large declines in other parts of the country (Chart 5). Through September 2020, wages in the state’s non-metro counties increased 1.2% from the beginning of the recession in February 2020, compared with a decrease of 3.5% nationally. Wages in Nebraska’s metro counties have declined in each of the past recessions, but also significantly less than the nation.

Chart 5: Change in Wages during Recessions by Geography is a bar chart that shows how average weekly wages changed during recessionary periods for metro and nonmetro areas in Nebraska and the United States. The bars show the percent change in average weekly wages from the beginning of each recession to the end. The first recession is the Dot-Com and 9/11 recession (March 2001 through November 2001). The second recession is the Financial Crisis and recession (December 2007 through June 2009). The third recession is the COVID-19 pandemic (February 2020 through the present – September 2020 on this chart). The data source is the BLS.

Goods-Producing Industries

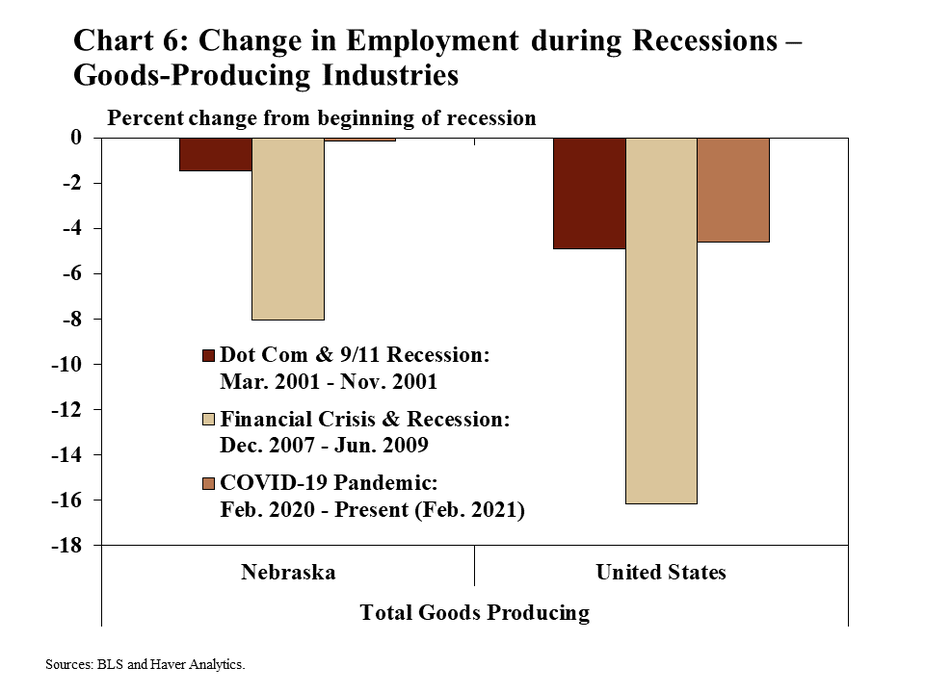
One factor underlying Nebraska’s resilience during recessions has been the strength of its goods-producing industries. In the last recession, employment among goods-producing firms dropped more than 16% in the U.S. from December 2007 through June 2009 (Chart 6). In Nebraska over the same period, the decrease was only 8%. Unlike the previous recession, businesses producing or manufacturing goods did not reduce jobs on the same scale alongside the pandemic of the past year. Nationally, employment declined only 4.6% from the beginning of the pandemic through February 2021. Similar to the last recession, however, job losses in Nebraska’s goods-producing industries have been much less and, as of February had been nearly recovered in total.

Chart 6: Change in Employment during Recessions – Goods-Producing Industries is a bar chart showing is a bar chart that shows how employment in goods-producing industries changed during recessionary periods for Nebraska and the United States. The bars show the percent change in employment from the beginning of each recession to the end. The first recession is the Dot-Com and 9/11 recession (March 2001 through November 2001). The second recession is the Financial Crisis and recession (December 2007 through June 2009). The third recession is the COVID-19 pandemic (February 2020 through the present – February 2021 on this chart). Data sources are the BLS and Haver Analytics.

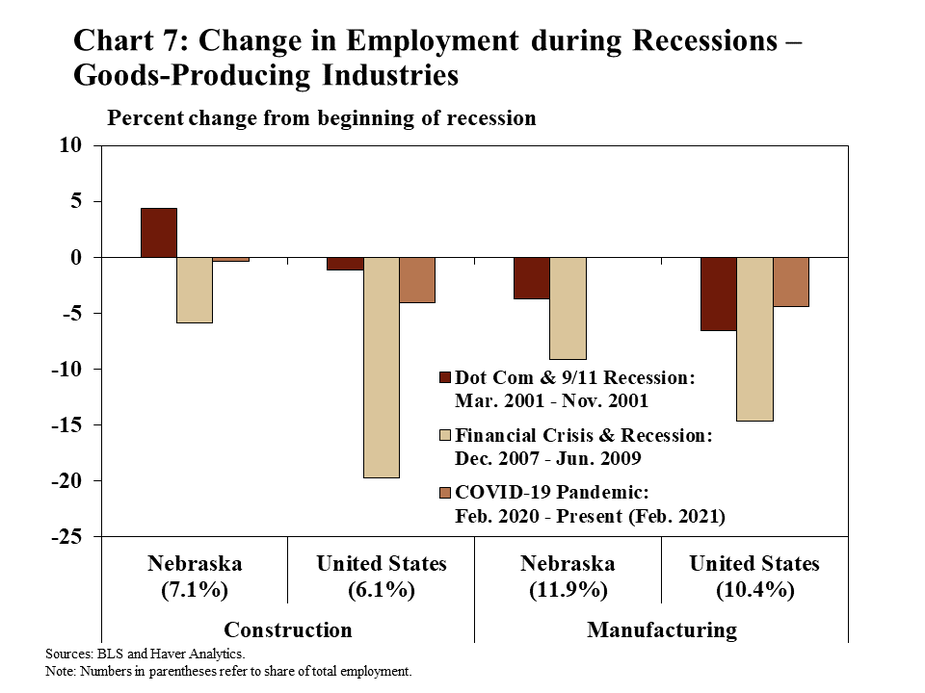
Employment in construction and manufacturing, specifically has remained significantly more stable in Nebraska during economic downturns. Construction and manufacturing firms account for nearly a fifth of the state’s jobs, and employment in both industries has remained solid over the course of the past year. During the last recession, job losses in the construction industry were about four times larger nationally than in Nebraska (Chart 7). In a similar pattern, and despite the severity of the pandemic, employment in construction was only 0.3% less in February 2021 than prior to the pandemic. Manufacturing sector job losses had been completely recovered.

Chart 7: Change in Employment during Recessions – Goods-Producing Industries is a bar chart that shows how employment in goods-producing industries changed during recessionary periods for Nebraska and the United States. The bars show the percent change in employment from the beginning of each recession to the end. Two goods-producing industries are shown for both jurisdictions – construction, which represents 7.1% of employment in Nebraska and 6.1% of employment in the United States; and manufacturing, which represents 11.9% of employment in Nebraska and 10.4% of employment in the United States. The first recession is the Dot-Com and 9/11 recession (March 2001 through November 2001). The second recession is the Financial Crisis and recession (December 2007 through June 2009). The third recession is the COVID-19 pandemic (February 2020 through the present – February 2021 on this chart). Data sources are the BLS and Haver Analytics.

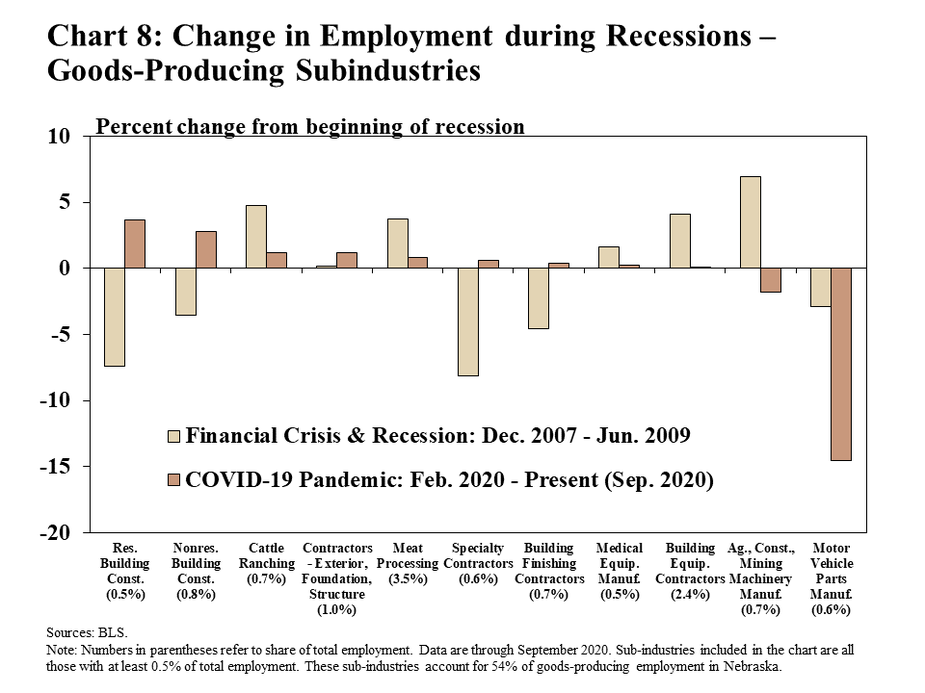
Moreover, economic conditions among specific types of goods-producing businesses in Nebraska have differed significantly from the 2007-09 financial crisis and recession. From December 2007 to June 2009, for example, both residential and nonresidential building construction firms experienced sharp declines in employment (Chart 8). In contrast, businesses in those industries actually have added jobs over the past year despite the pandemic. While employment at manufacturers of motor vehicle parts has declined significantly from a year ago, most other types of manufacturing and construction firms currently have larger workforces than before the pandemic.

Chart 8: Change in Employment during Recessions – Goods-Producing Subindustries is a bar chart that shows how employment in goods-producing subindustries changed during recessionary periods for Nebraska and the United States. The bars show the percent change in employment from the beginning of each recession to the end. Eleven goods-producing subindustries are shown for both jurisdictions. All subindustries shown comprise at least 0.5% of total employment and all together account for 54% of goods-producing employment in Nebraska. The industries are: residential building construction (0.5% of employment in Nebraska); nonresidential building construction (0.8% of employment in Nebraska); cattle ranching (0.7% of employment in Nebraska); contractors – exterior, foundation, and structure (1% of employment in Nebraska); meat processing (3.5% of employment in Nebraska); specialty contractors (0.6% of employment in Nebraska); building finishing contractors (0.7% of employment in Nebraska); medical equipment manufacturers (0.5% of employment in Nebraska); building equipment contractors (2.4% of employment in Nebraska); agriculture, construction, and mining machinery manufacturing (0.7% of employment in Nebraska); and motor vehicle parts manufacturing (0.6% of employment in Nebraska). The first recession is the Financial Crisis and recession (December 2007 through June 2009). The second recession is the COVID-19 pandemic (February 2020 through the present – September 2020 on this chart). The data source is the BLS.

Service-Providing Industries

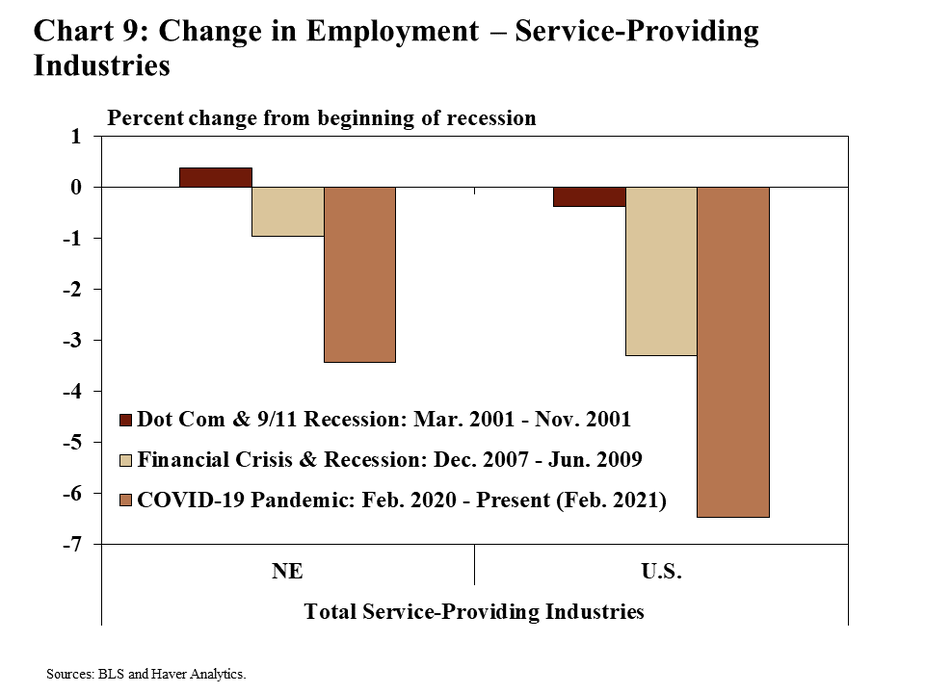
While the COVID-19 pandemic has had a large impact on businesses of all types, businesses providing a broad range of services in Nebraska have maintained employment levels better than the nation. As of February 2021, employment at service-oriented firms in Nebraska was about 3.4% less than before the pandemic (Chart 9). Unlike the relative stability among goods-producing firms during the pandemic, job losses in the services sector have been about twice as large as the past recession. Nebraska’s service-based firms, however, have weathered each of the past three recessions better than the nation in a pattern resembling the state’s economy more generally.

Chart 9: Change in Employment during Recessions – Service-Providing Industries is a bar chart showing is a bar chart that shows how employment in service-providing industries changed during recessionary periods for Nebraska and the United States. The bars show the percent change in employment from the beginning of each recession to the end. The first recession is the Dot-Com and 9/11 recession (March 2001 through November 2001). The second recession is the Financial Crisis and recession (December 2007 through June 2009). The third recession is the COVID-19 pandemic (February 2020 through the present – February 2021 on this chart). Data sources are the BLS and Haver Analytics.

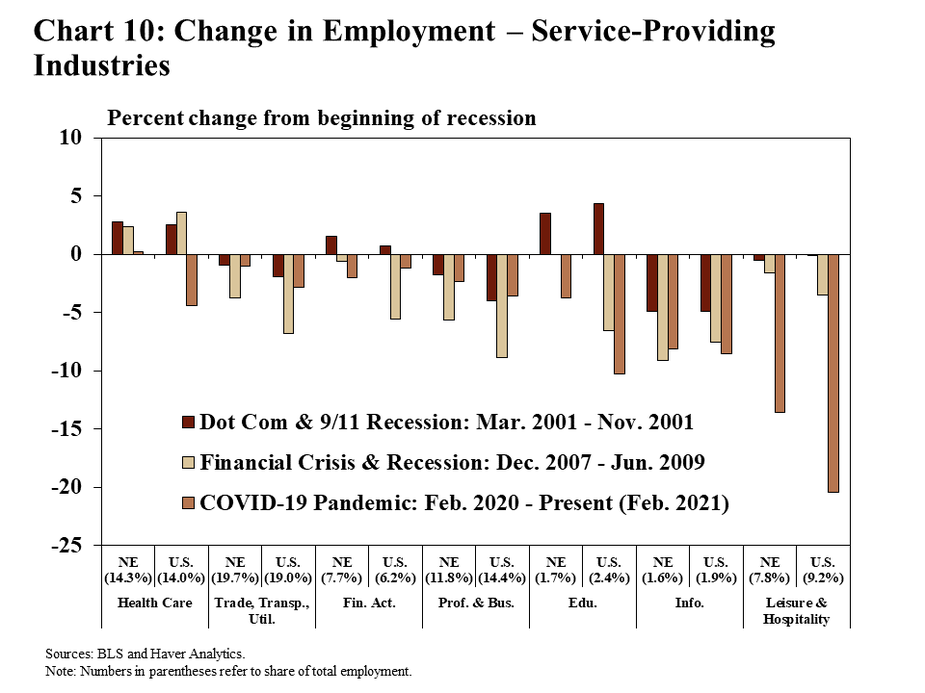
Still, some segments of Nebraska’s service-based economy have continued to face extreme headwinds alongside the pandemic in sharp contrast to past recessions. Much like the nation, the biggest driver of job losses in the services sector has been in the leisure and hospitality industry (Chart 10). With restrictions on gatherings of people during the pandemic, job losses in this industry have far outpaced those of the previous recession. In Nebraska, however, this industry accounts for a smaller share of total employment (7.8%) than the national average (9.2%), and the declines in employment also have been more modest. Most other service-based industries in the state also have experienced job losses due to the pandemic, but to a lesser degree overall.

Chart 10: Change in Employment during Recessions – Service-Providing Industries is a bar chart showing is a bar chart that shows how employment in service-providing industries changed during recessionary periods for Nebraska and the United States. The bars show the percent change in employment from the beginning of each recession to the end. Seven service-providing industries are shown for each jurisdiction: health care (14.3% of employment in Nebraska and 14% of employment in the United States); trade, transportation, and utilities (19.7% of employment in Nebraska and 19% of employment in the United States); financial activities (7.7% of employment in Nebraska and 6.2% of employment in the Unites States); professional and business services (11.8% of employment in Nebraska and 14.4% of employment in the United States); educational services (1.7% of employment in Nebraska and 2.4% of employment in the United States); information (1.6% of employment in Nebraska and 2.4% of employment in the United States); and leisure and hospitality (7.8% of employment in Nebraska and 9.2% of employment in the United States. The first recession is the Dot-Com and 9/11 recession (March 2001 through November 2001). The second recession is the Financial Crisis and recession (December 2007 through June 2009). The third recession is the COVID-19 pandemic (February 2020 through the present – February 2021 on this chart). Data sources are the BLS and Haver Analytics.

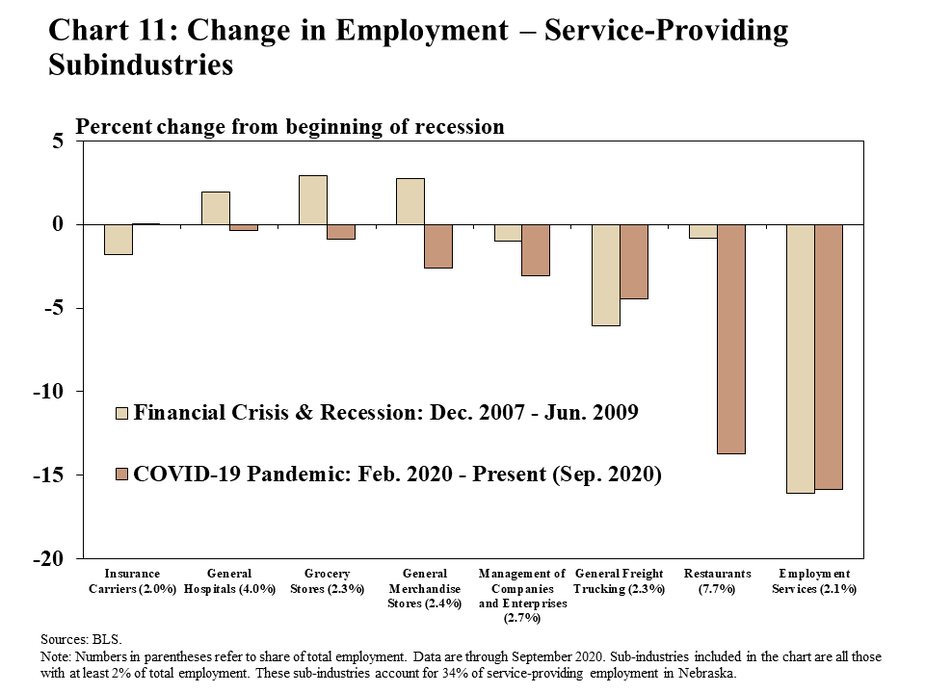
Although businesses gradually have reopened in recent months, job cuts at restaurants, specifically, have weighed heavily on the economy in Nebraska and the nation. In Nebraska, restaurants account for most of the state’s leisure and hospitality industry, and 7.7% of the state’s employment. As of September 2020, employment at restaurants in the state was almost 14% less than before the pandemic and generally has remained weak in recent months (Chart 11). Underscoring ongoing weakness in the economy, employment services firms, which account for about 2% of the state’s employment, also remained under pressure.

Chart 11: Change in Employment during Recessions – Service-Providing Subindustries is a bar chart that shows how employment in service-providing subindustries changed during recessionary periods for Nebraska and the United States. The bars show the percent change in employment from the beginning of each recession to the end. Eight service-providing subindustries are shown for both jurisdictions. All subindustries shown comprise at least 2% of total employment and all together account for 34% of service-providing employment in Nebraska. The industries are: insurance carriers (2% of employment in Nebraska); general hospitals (4% of employment in Nebraska); grocery stores (2.3% of employment in Nebraska); general merchandise stores (2.4% of employment in Nebraska); management of companies and enterprises (2.7% of employment in Nebraska); general freight trucking (2.3% of employment in Nebraska); restaurants (7.7% of employment in Nebraska); and employment services (2.1% of employment in Nebraska). The first recession is the Financial Crisis and recession (December 2007 through June 2009). The second recession is the COVID-19 pandemic (February 2020 through the present – September 2020 on this chart). The data source is the BLS.

Business Stress and Housing

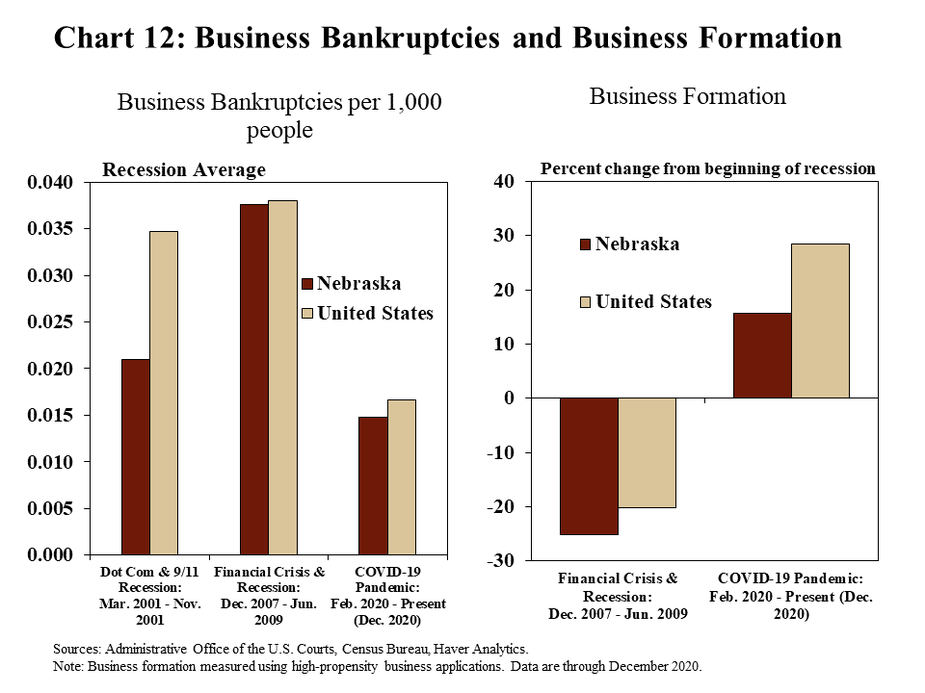
Despite ongoing stress among some service-based firms, some measures indicate the general business environment has remained more stable than in the last recession. The 2007-09 financial crisis and recession resulted in a significant increase in business bankruptcies and a sharp reduction in the formation of new businesses (Chart 12). Unlike that recession, bankruptcies in Nebraska have been relatively muted, mirroring the nation. In addition to fewer businesses closing or entering bankruptcy, new businesses have also continued to form, though to a lesser degree in Nebraska. The limited number of bankruptcies and uptick in new businesses has likely been due, at least in part, to significant fiscal and monetary policy support over the past year.

Chart 12: Business Bankruptcies and Business Formation are two bar charts showing business bankruptcies per 1,000 people and business formation for Nebraska and the United States. Business bankruptcies are averages for three recessions: the Dot-Com and 9/11 recession (March 2001 through November 2001, the Financial Crisis and recession (December 2007 through June 2009), and the COVID-19 pandemic (February 2020 through the present – December 2020 on this chart). Business formation is measured using high-propensity business applications and is shown as the percent change from the beginning of each recessionary period. Two recessions are shown for business formation: the Financial Crisis and recession (December 2007 through June 2009), and the COVID-19 pandemic (February 2020 through the present – December 2020 on this chart). The data sources are the Administrative Office of the U.S. Courts, the Census Bureau, and Haver Analytics.

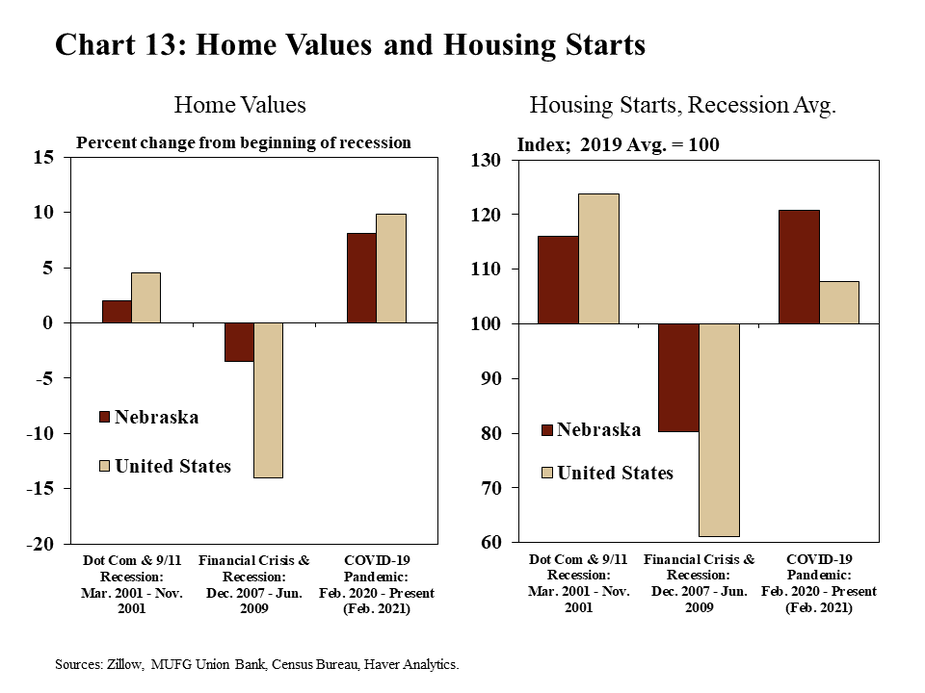
In notable contrast to the last recession, the housing market also has continued to strengthen during the course of the pandemic. For many households, home values represent a large portion of wealth and financial health. During the 2007-2009 recession, a sharp decline in home prices led to more severe financial challenges across the country. In contrast to that recession, however, home prices have continued to rise at a strong pace over the past year and housing starts also have edged higher (Chart 13). In Nebraska, home prices are up over 8% from a year ago, though this increase is slightly less than the nation overall.

Chart 13: Home Values and Housing Starts are two bar charts showing home values and housing starts for Nebraska and the United States. Home values are shown as the percent change from the beginning of three separate recessionary periods: the Dot-Com and 9/11 recession (March 2001 through November 2001, the Financial Crisis and recession (December 2007 through June 2009), and the COVID-19 pandemic (February 2020 through the present – February 2021 on this chart). Housing starts are indexed to the 2019 annual average and are shown as the average value for three recessionary periods: the Dot-Com and 9/11 recession (March 2001 through November 2001, the Financial Crisis and recession (December 2007 through June 2009), and the COVID-19 pandemic (February 2020 through the present – February 2021 on this chart). The data sources are Zillow, MUFG Union Bank, the Census Bureau, and Haver Analytics.

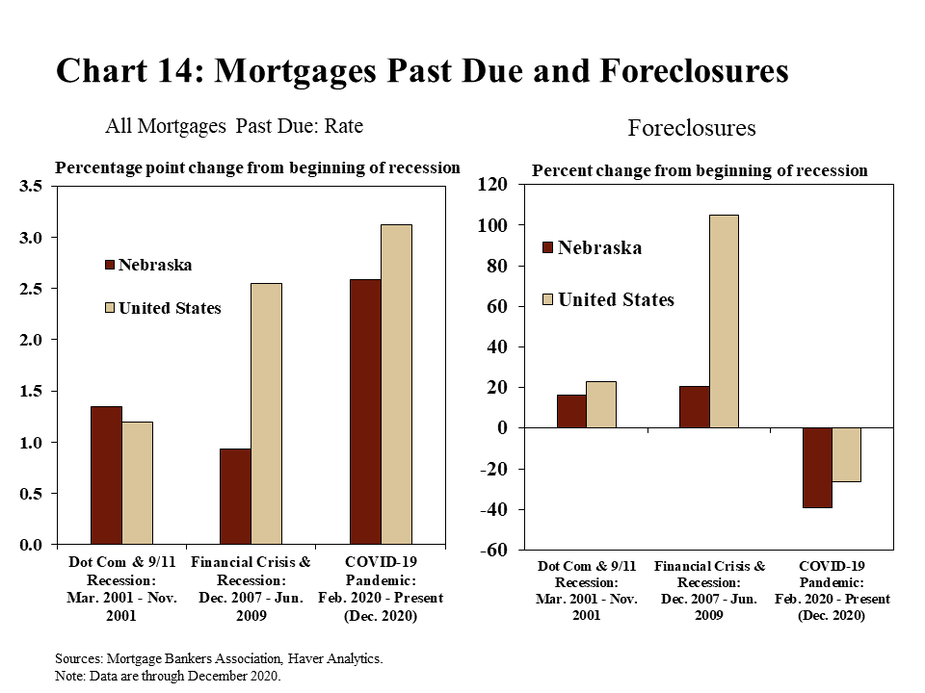
Despite the strength of Nebraska’s housing market, however, financial stress for some existing homeowners has increased and must be monitored closely. Whereas many indicators have returned to, or are nearing pre-pandemic strength, mortgage delinquency rates have increased in both Nebraska and the nation. While foreclosures remain less than before the pandemic, mortgages that were past due as of the fourth quarter of 2020 were more than 2.5 percentage points higher than a year ago in Nebraska, and considerably higher than in the past recession (Chart 14).

Chart 14: Mortgages Past Due and Foreclosures are two bar charts showing delinquent mortgage rates and foreclosures for Nebraska and the United States. Delinquent mortgage are shown as the percentage point change in the rate of all mortgages past due from the beginning of three separate recessionary periods: the Dot-Com and 9/11 recession (March 2001 through November 2001, the Financial Crisis and recession (December 2007 through June 2009), and the COVID-19 pandemic (February 2020 through the present – December 2020 on this chart). Foreclosures are shown as the percent change from the beginning of three recessionary periods: the Dot-Com and 9/11 recession (March 2001 through November 2001, the Financial Crisis and recession (December 2007 through June 2009), and the COVID-19 pandemic (February 2020 through the present – December 2020 on this chart). The data sources are the Mortgage Bankers Association and Haver Analytics

Conclusion

At the start of 2021, Nebraska’s economy appeared to be positioned better than most other states. Employment was at, or near, pre-pandemic strength in many industries. Conditions in rural parts of the state have been more stable than both metro areas and other rural areas nationwide. Stability has been a feature of Nebraska’s economy in recent recessions for a variety of possible reasons, including the composition of industries most prevalent in the state. While significant business and economic challenges still remain, the stability of Nebraska’s economy is likely to position the state well for a return to steady growth in coming months.

Authors

Nate Kauffman

Senior Vice President, Economist, and Omaha Branch Executive

Nate Kauffman is Senior Vice President and Omaha Branch Executive at the Federal Reserve Bank of Kansas City. In his role as the Kansas City Fed's lead economist and represe…

John McCoy

Associate Economist

John McCoy is an associate economist in the Regional Affairs Department at the Omaha Branch of the Federal Reserve Bank of Kansas City. In this role, he supports research and out…