Economic disparities in Nebraska existed well before the 2020 pandemic. Prior to the pandemic, Nebraska’s economy was well positioned, with low unemployment, steady job gains and an upward trend in household incomes. These economic indicators, however, have differed markedly across the state, particularly in the urban areas of Omaha and Lincoln.
A Snapshot of High Unemployment and Low Income Areas
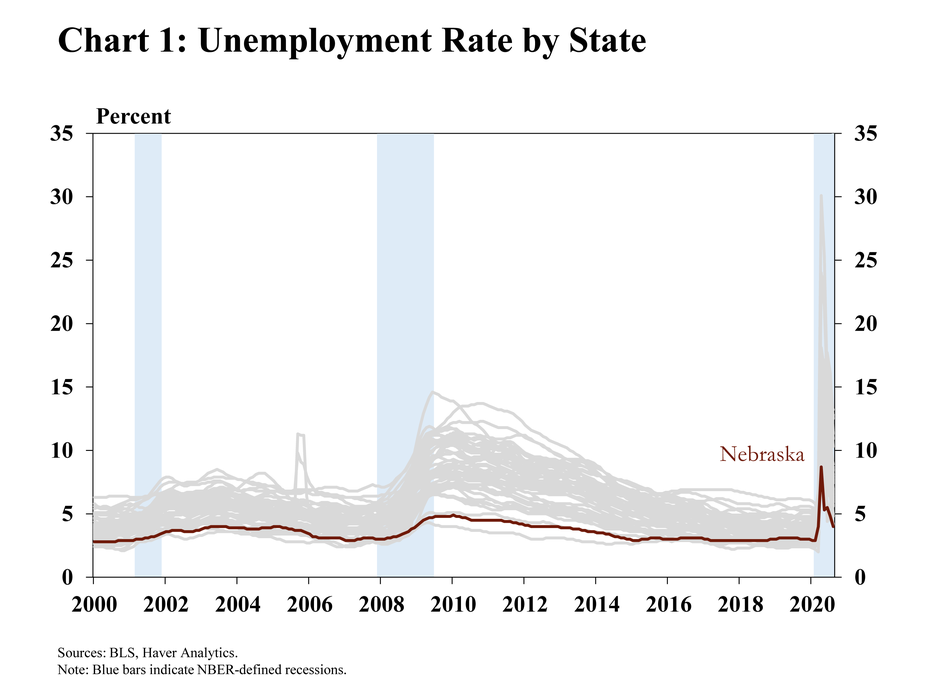
Prior to the pandemic, Nebraska had one of the lowest unemployment rates in the country. From late 2014 to early 2020, Nebraska’s unemployment never exceeded 3.1% (Chart 1). Despite a significant increase in job losses early in the pandemic that was in line with other states, Nebraska’s unemployment rate has remained among the lowest in the nation.
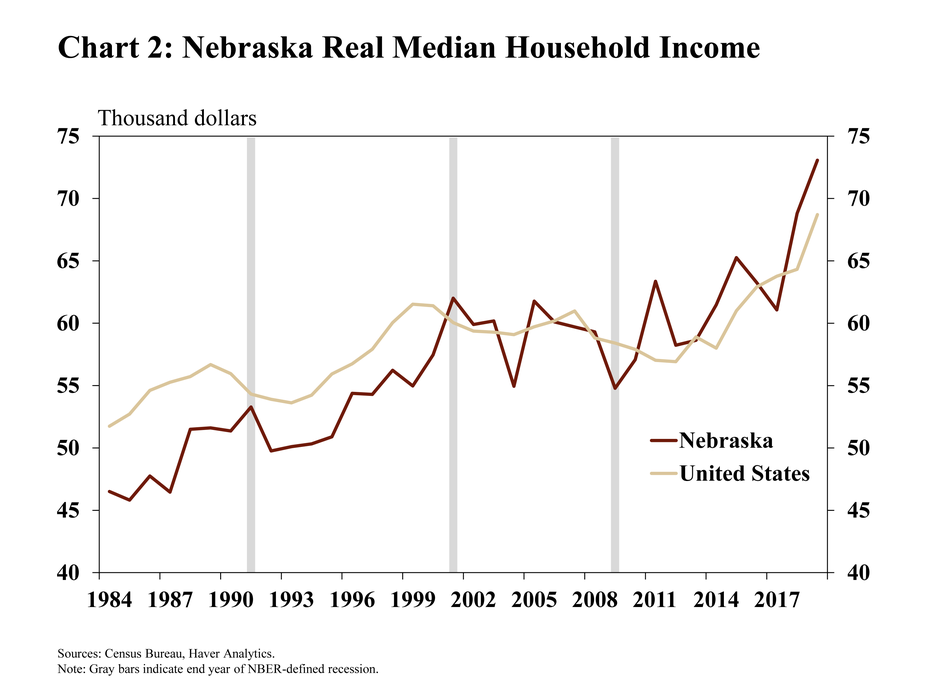
Following the Great Recession of 2007-09, household income in Nebraska advanced at a pace slightly faster than the nation. From 2010 to 2019, median household income increased 28% in Nebraska and 18% in the U.S. overall (Chart 2). In 2018, half of Nebraska’s households earned an income greater than $73,000, up from less than $55,000 in the late 1990s when adjusted for inflation.
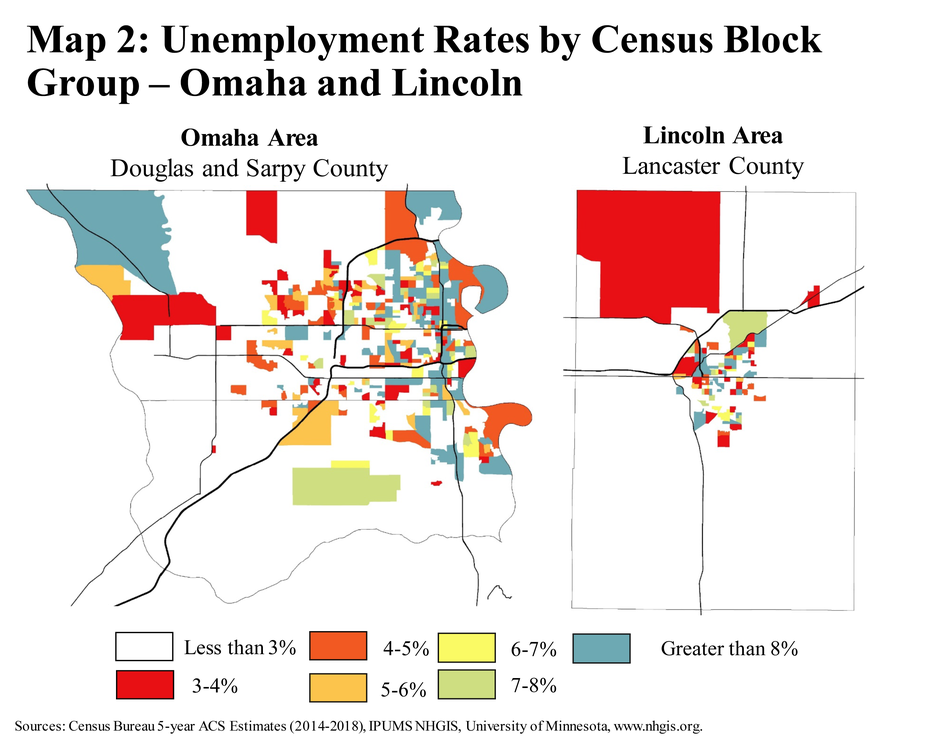
Despite broad economic progress in Nebraska since the recession, there still were significant economic disparities well before the onset of the 2020 pandemic. When assessing labor markets at a local level based on census block groups, large portions of the state had unemployment rates less than 3% (Map 1). In fact, unemployment was less than 3% in more than half of these census block groups during the five-year period ending in 2018. However, this assessment also reveals a number of areas where unemployment rates were greater than 8%, a rate even higher than the months of peak unemployment during the 2020 pandemic. Disparities in local unemployment rates were especially pronounced in the state’s largest metropolitan areas of Omaha and Lincoln (Map 2).
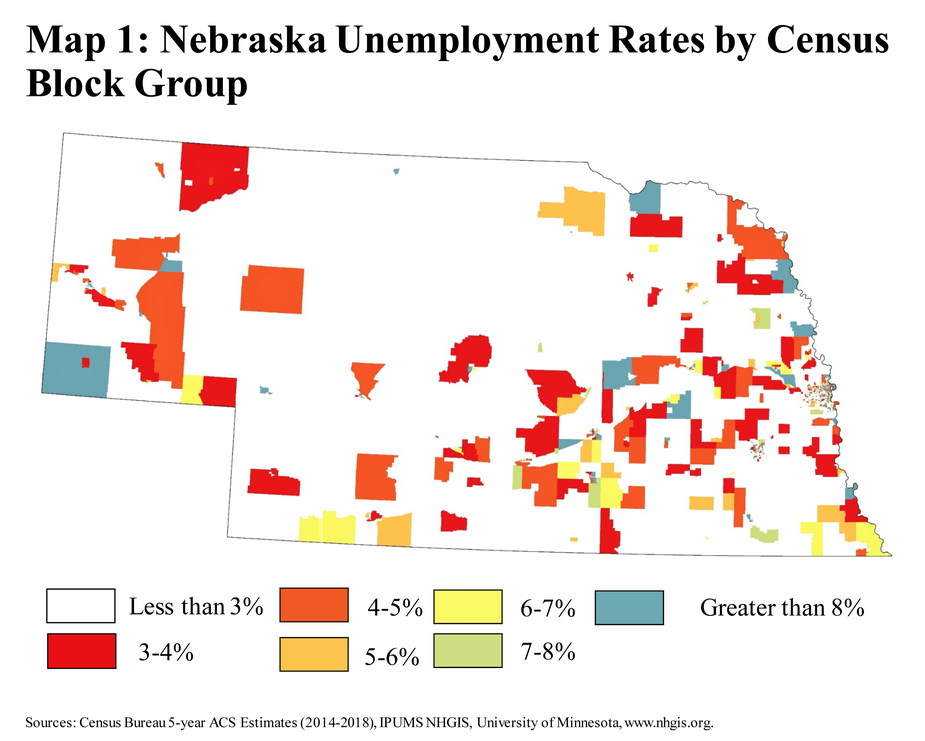
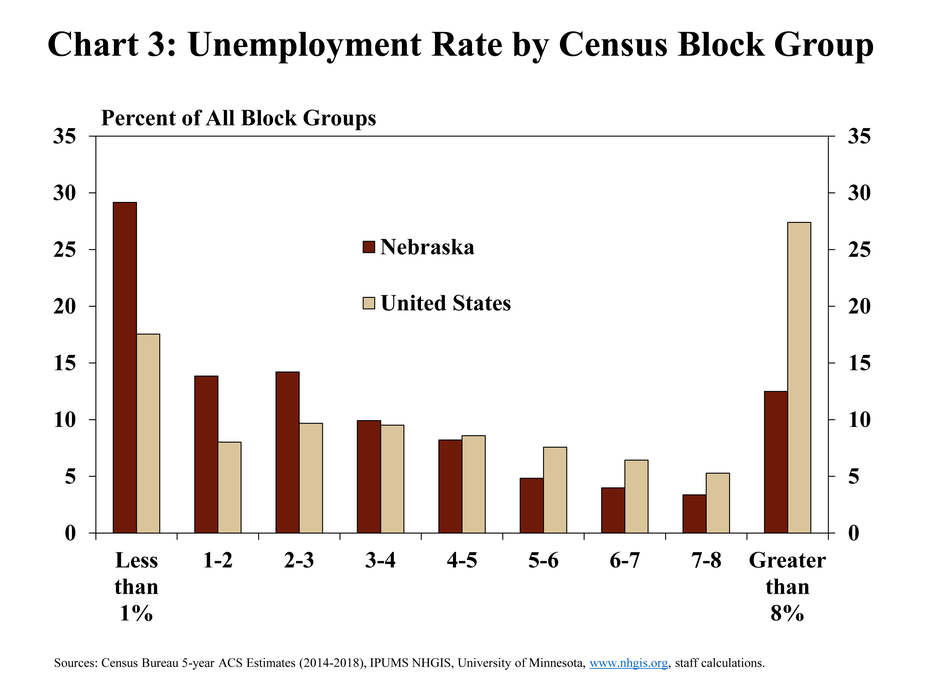
The prevalence of high unemployment census blocks in Nebraska has been less than the nation, but still notable. Through 2018, 12.5% of census block groups in the state had an unemployment rate in excess of 8% (Chart 3). Nationally, more than 25% of census blocks had an unemployment rate higher than 8%, underscoring the overarching environment of low unemployment in Nebraska despite the variation.
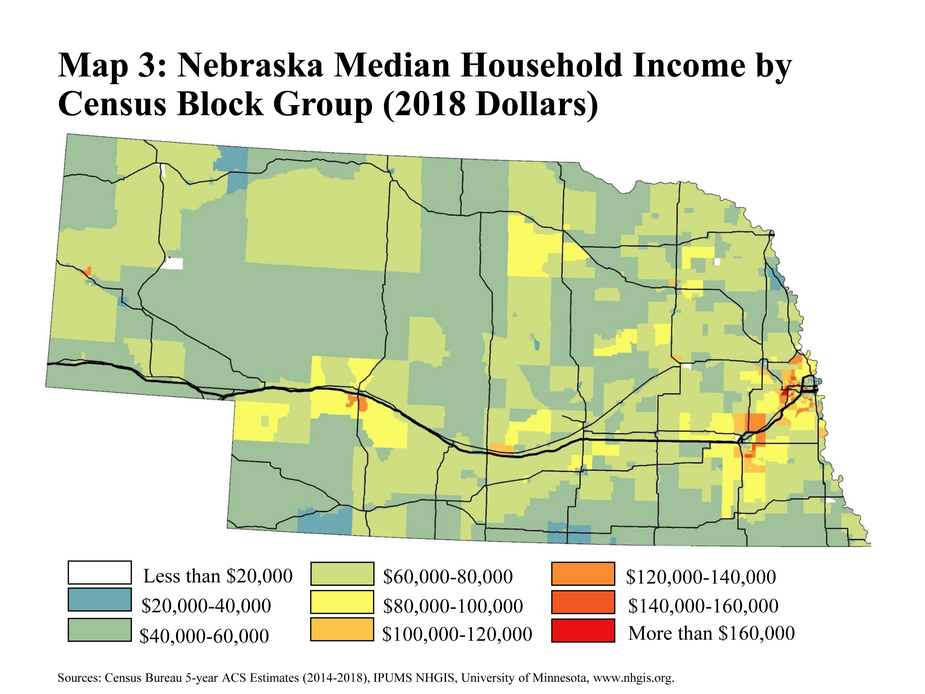
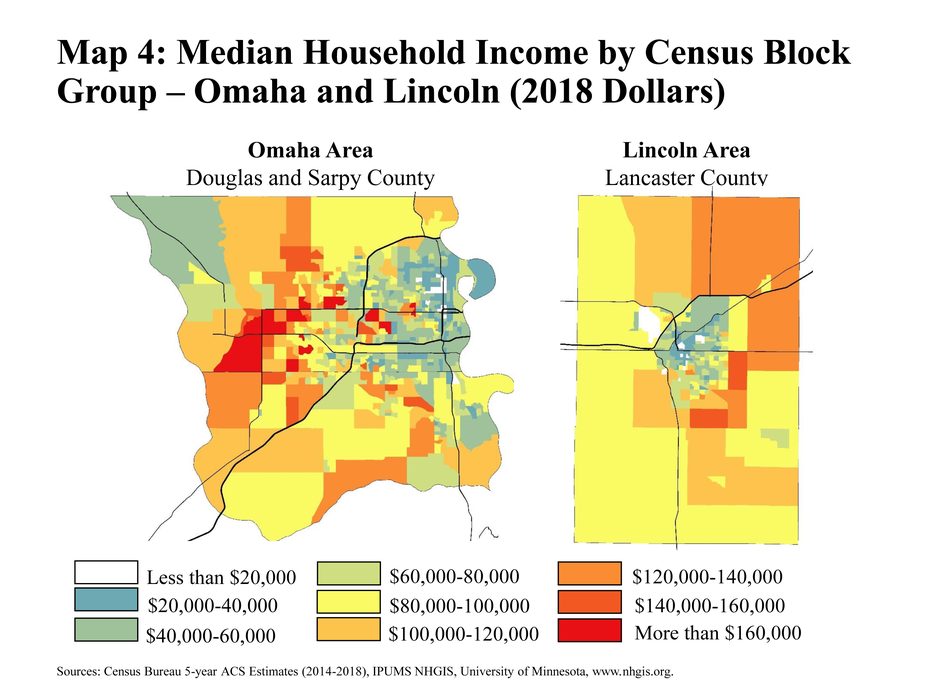
Similar to regional employment disparities, household incomes also have varied significantly throughout the state. Incomes earned in Omaha and Lincoln have been significantly higher than those in rural parts of the state (Map 3). However, significant disparities have remained even in Omaha and Lincoln. In eastern Douglas County, for example, household incomes were less than $60,000 per year in most neighborhoods (census block groups), in contrast to a large number of neighborhoods in West Omaha with incomes greater than $100,000 (Map 4).
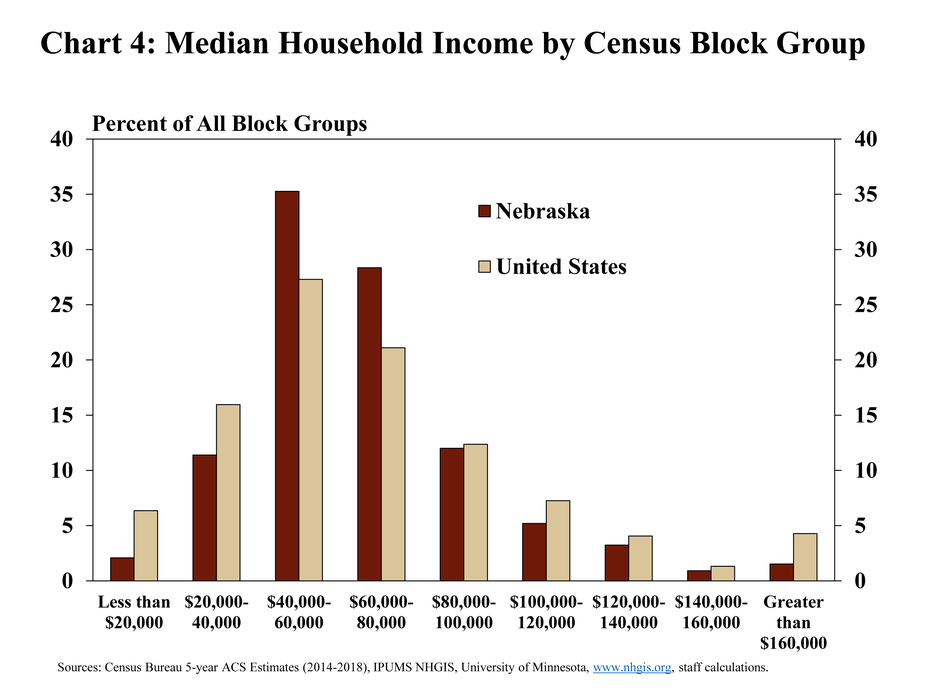
Despite the wide variations in income across the state, Nebraska has had a larger concentration of moderate- and middle-income areas than in the nation. Through 2018, more than 75% of census block groups in Nebraska had a median annual household income between $40,000 and $100,000 (Chart 4). Although a notable share of block groups had median incomes less than $40,000 and more than $100,000 in Nebraska, the percentage of both high-income and low-income regions typically has been less than in the United States at large.
Economic Disparities by Type of Region
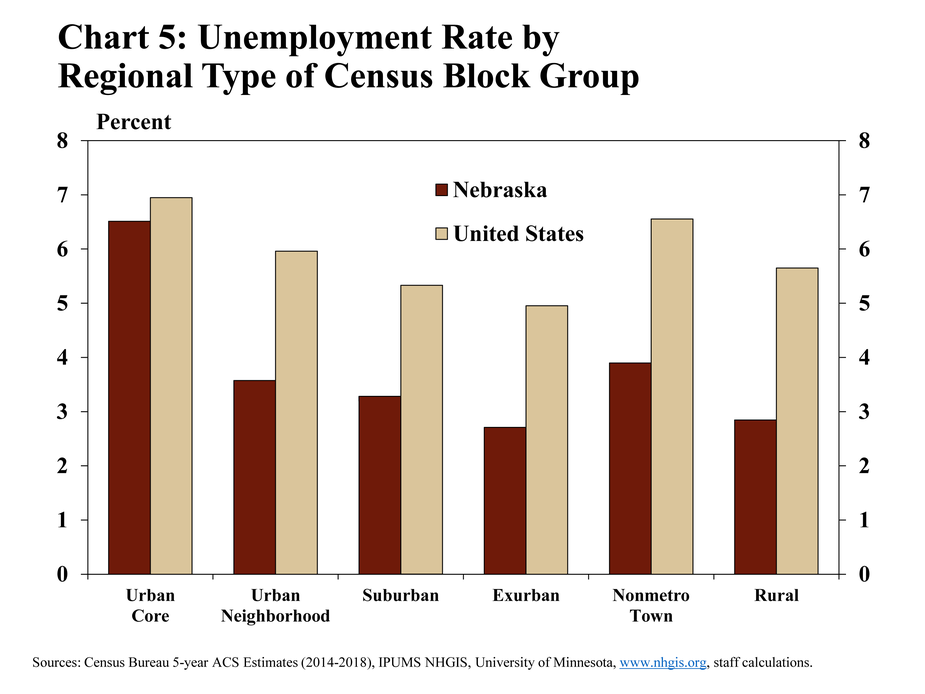
All types of communities in Nebraska typically have had lower unemployment than the nation. The state’s metropolitan areas, ranging from the downtown urban core1 to exurban metro communities far from downtown, all had lower rates of unemployment from 2014 through 2018 compared with the United States (Chart 5). Unemployment in the most rural areas of the state was less than 3%, in contrast to nearly 6% nationally. By geography, unemployment in Nebraska’s urban core most closely has matched that of the nation relative to other types of regions. Unemployment in these most dense neighborhoods generally also has been much higher than less dense areas of all types across the state.
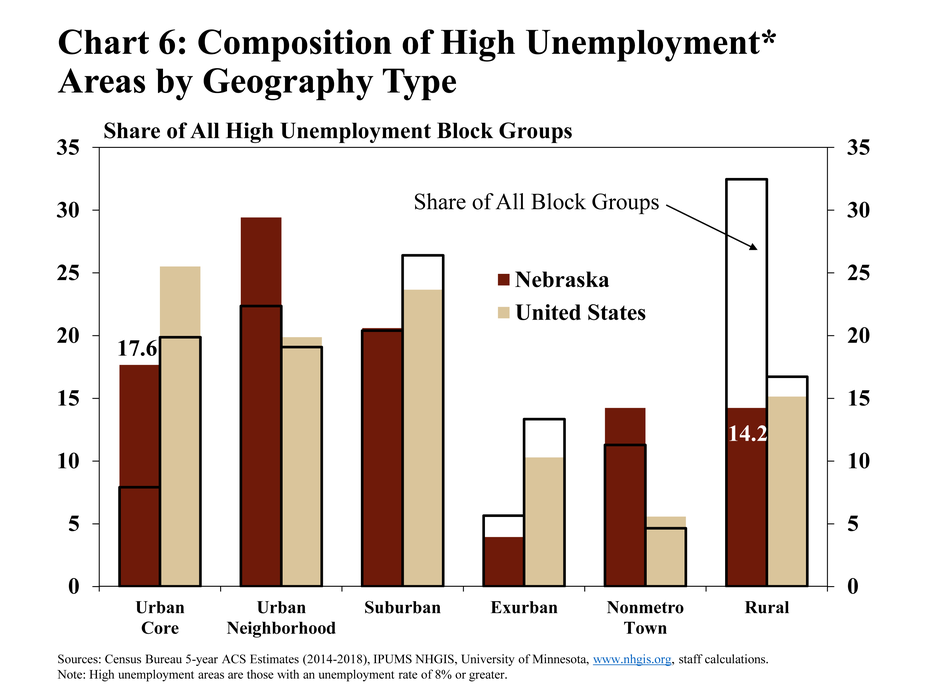
Although job growth has been strongest in urban areas and weakest in rural areas in recent years, unemployment rates have been disproportionately high in some urban communities and low in rural areas. In Nebraska, regions defined as the urban core accounted for only 7.9% of all census block groups in the state. However, these urban core regions comprised 17.6% of all high unemployment (greater than 8%) census block groups (Chart 6). In contrast, rural areas accounted for 32.4% of Nebraska’s census block groups, but only 14.2% of those with high unemployment. These disparities between Nebraska’s urban core and its rural areas have been considerably wider than at the national level.
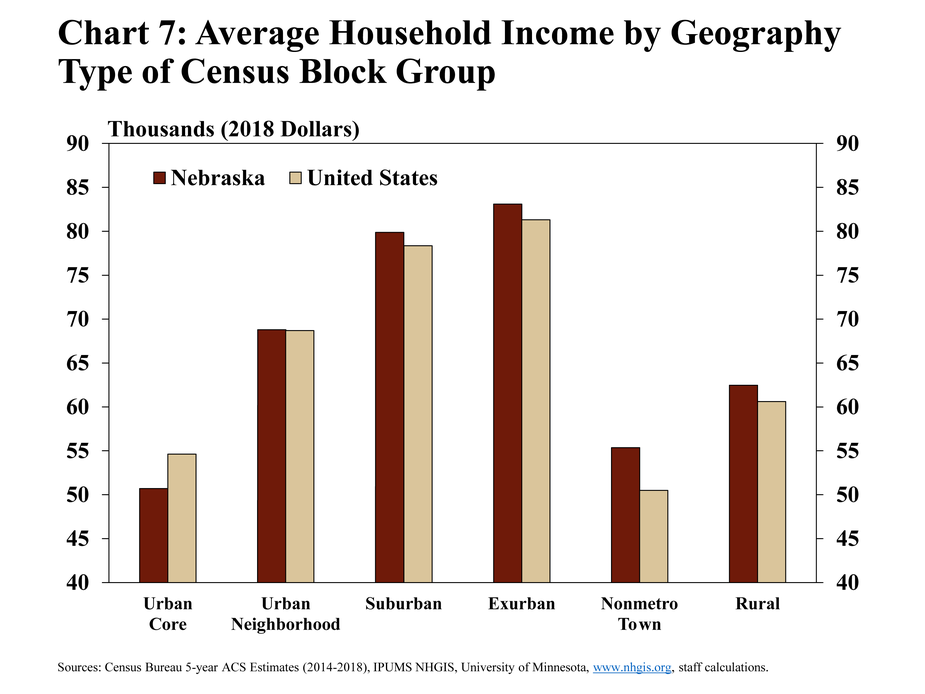
In contrast to employment disparities, average incomes of Nebraska households have been quite similar to national averages based on the type of region. From 2014 to 2018, household incomes were highest in regions classified as exurban at more than $83,000 per year (Chart 7). Household incomes in the urban core were about $50,000, on average, and were also the only region type with incomes less than the nation.
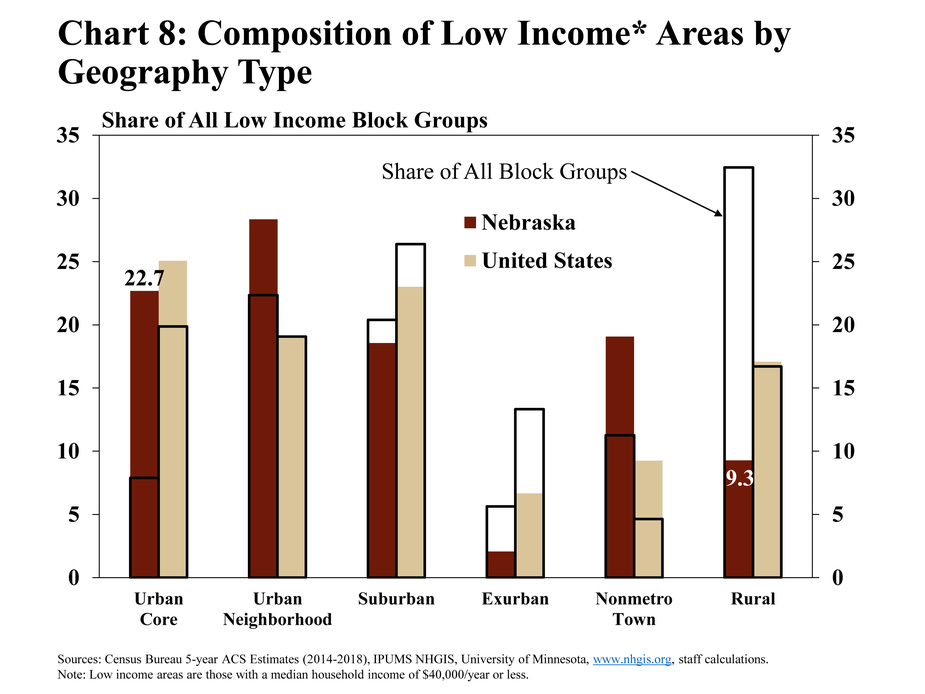
However, income disparities across census blocks have been much wider in Nebraska than in the nation based on the type of region. The urban core in Nebraska accounted for 22.7% of low income (less than $40,000 per year) census block groups, a disproportionately large concentration based on the limited prevalence of urban core neighborhoods (Chart 8). Rural census block groups accounted for only 9.3% of low income groups, despite the high concentration of rural areas in Nebraska.
Economic Disparities by Demographic Groups
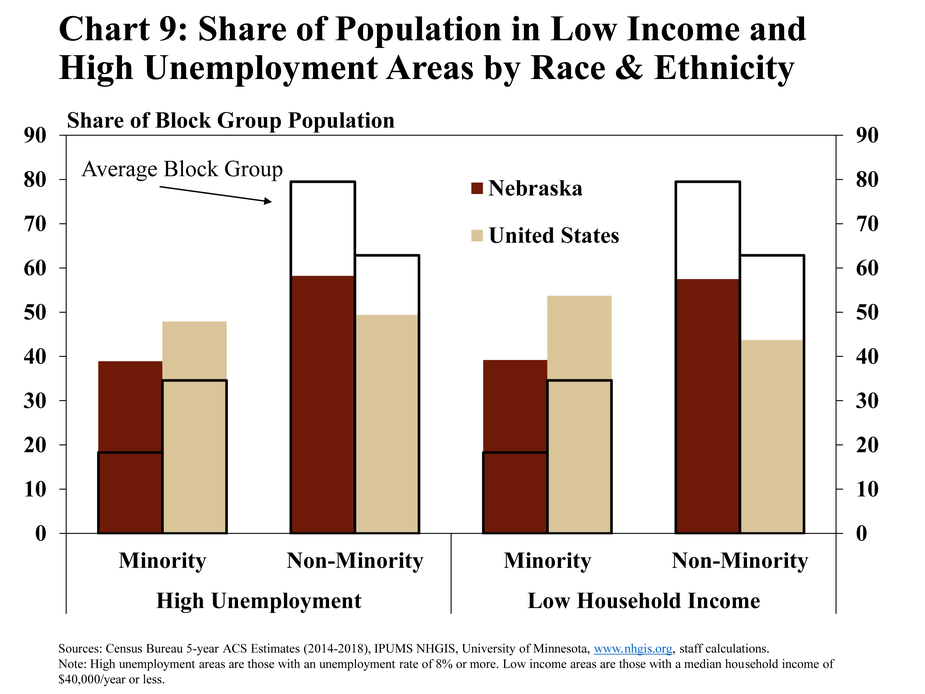
Similar to the nation, high unemployment and low income areas of Nebraska have had a higher concentration of minorities. The share of minorities in census block groups defined as having high unemployment was almost 40% from 2014 to 2018, even though minorities accounted for less than 20% of the population, on average, across census block groups (Chart 9). Minorities also accounted for a disproportionately large concentration of residents in low income regions of the state.
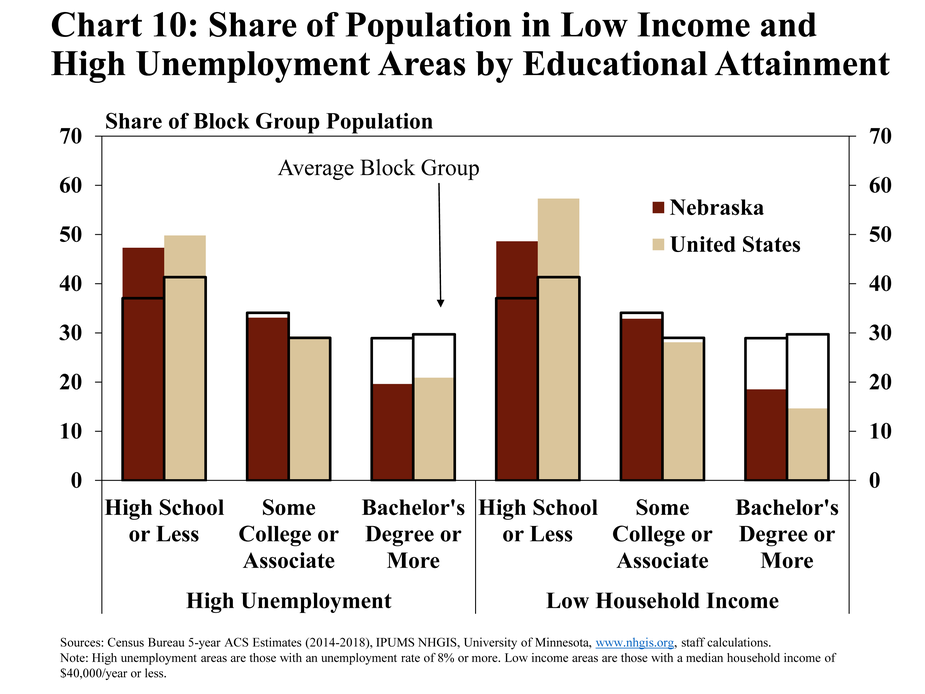
Regions with less education, in aggregate, also have had higher unemployment and lower incomes, mirroring the nation. In high unemployment or low income census block groups, the share of the population with an education at the high school level, or less, was nearly 50% (Chart 10). By comparison, only 37% of the state’s population consisted of individuals with a high school education or less. Of residents in high unemployment and low income areas, only about 20% hold a bachelor’s degree or higher.
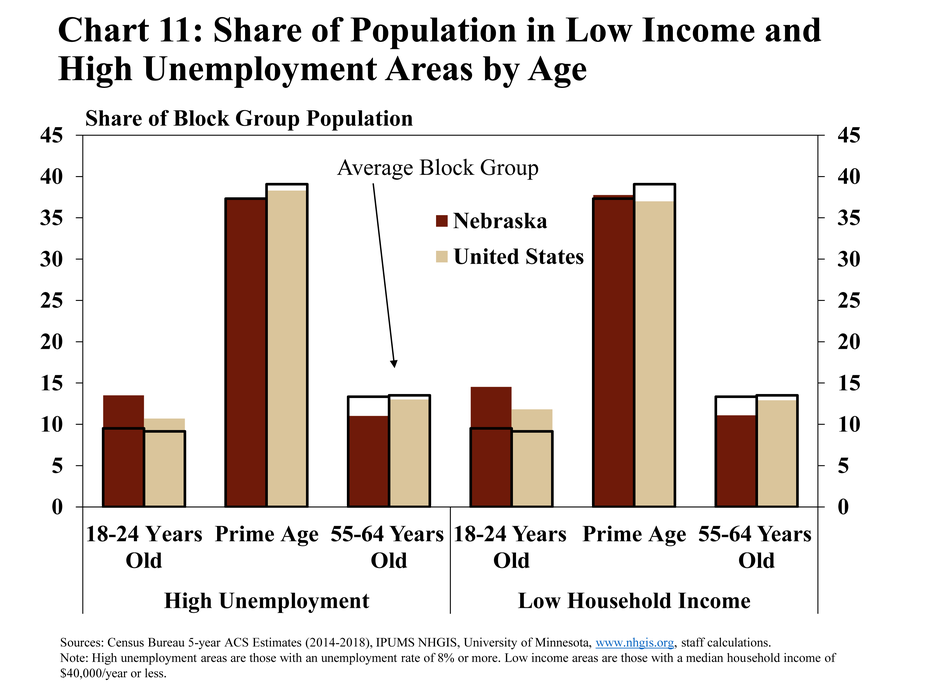
Relative to other demographic breakdowns, the age distribution of regions across the state have shown the least amount of economic disparity. High unemployment and low income census block groups have tended to have a slightly higher concentration of young adults than the share of the population this age group accounts for (Chart 11). As might be expected by a lifetime progression of increasing employment potential and income gains, older individuals comprise a smaller share of these high unemployment and low income regions.
Conclusion
Nebraska’s economy has improved in recent months, following the initial impact of the 2020 pandemic and associated lockdowns. Unemployment has edged lower and consumer spending appears to have rebounded somewhat. However, economic disparities have persisted in Nebraska over time. The pandemic likely has exacerbated some of these disparities more recently as its effects have been most pronounced on low-wage jobs concentrated in the services sector. Addressing these economic disparities may remain a significant challenge for the state in the years ahead.
Notes:
1 Geography types are defined based on the number of residents per square mile as follows:
a. Metropolitan Counties:
i. Urban Core - greater than 7,747
ii. Urban Neighborhood – less than 7,747 but more than 3,770
iii. Suburban – less than 3,770 but more than 738
iv. Exurban – less than 738 but more than 54
v. Rural – less than 53
b. Nonmetropolitan Counties:
i. Nonmetro Town block groups – more than 738
ii. Rural – less than 738 or in a county with a total population of less than 2,500
The views expressed are those of the authors and do not necessarily reflect the positions of the Federal Reserve Bank of Kansas City or the Federal Reserve System.
Authors

Nate Kauffman
Senior Vice President, Economist, and Omaha Branch Executive; Executive Director of the Center for Agriculture and the Economy