Businesses and consumers alike have cited elevated levels of uncertainty around international trade policy in 2025 as the U.S. average effective tariff rate increased from around 2% to 18% as of October (Budget Lab 2025). This edition of the Oklahoma Economist examines the concentration of the state’s exports and imports to determine how it could be exposed to trade disruptions. It finds that Oklahoma’s international trade has focused on select products, particularly aerospace exports and oil imports from Canada. The state’s manufacturing employment has grown this year but has been concentrated in sectors that rely on international trade such as aerospace parts, metals, and machinery. While Oklahoma has less exposure to international trade in aggregate, the state’s specialization in these trade-heavy sectors and its reliance on Canadian oil could leave pockets of its economy exposed to trade disruptions.
International trade has made up a smaller share of activity in Oklahoma but has more importance in certain products
International trade has comprised a smaller share of Oklahoma’s economy compared with the rest of the United States. Oklahoma’s exports consistently accounted for around 2.5-4% of the state’s Gross Domestic Product (GDP), or about half the national average (Chart 1, left panel). Similarly, the state’s imports as a share of GDP has remained around half the U.S. total. Although the import share of GDP has varied more widely over time, imports made up 5.8% of Oklahoma state GDP in Q2 2025, compared with 10.9% in the U.S. (Chart 1, right panel). This could indicate that trade issues have affected Oklahoma less than other parts of the nation, but the product composition of the state’s exports may leave it more exposed to disruptions in certain sectors and countries.
Chart 1: International trade makes up a smaller share of Oklahoma’s economy.
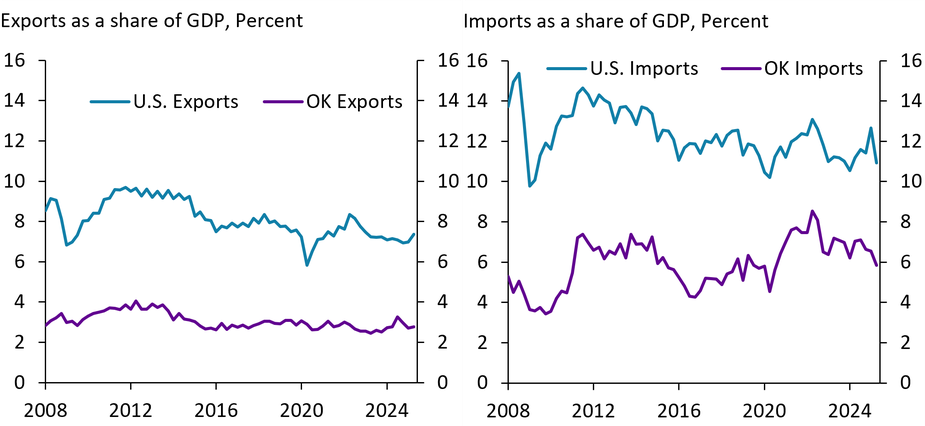
Sources: U.S. Census Bureau, U.S. Bureau of Economic Analysis (Haver Analytics), authors’ calculations
The global destinations of Oklahoma’s exports have largely resembled the nation’s, while the sourcing of international inputs into the state is less diversified. Europe, Canada, and Asian countries excluding China each accounted for about a quarter of the state’s exports in 2024 (Chart 2, left panel). Oklahoma exports a smaller share of goods to Mexico and China than other states but exports a greater share of its goods to Canada. Similarly, a much higher share of the state’s imports (50%) was sourced from Canada compared with the U.S. total. China was the second-largest source of imported goods at 15%, a similar share to the U.S. total, followed closely by Europe and other Asian countries. (Chart 2, right panel). Only a small share of products imported into Oklahoma in 2024 were sourced from Mexico.
Chart 2: Half of Oklahoma’s exports go to Europe and Canada, and Oklahoma’s imports are much more concentrated in Canada.
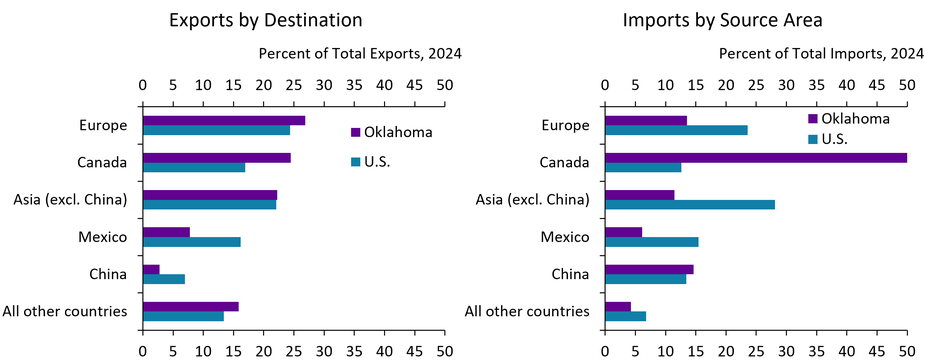
Sources: U.S. Census Bureau (USA Trade), authors’ calculations
Although the state’s exports have been well-diversified across the globe, they have been more concentrated in certain products, specifically durable goods, than the United States in total. Transportation equipment exports made up a third of all of Oklahoma’s exports in 2024 and metals and machinery accounted for nearly another third. Combined, transportation equipment, metals, and machinery made up most of all exported goods out of the state in 2024 (Chart 3, left panel)_. Computers and electrical equipment as well as mining and chemical exports were also key products for trade in both the U.S. and Oklahoma.
Oklahoma’s imports also have a high concentration in key commodities, particularly oil. Although the nation’s imports were relatively balanced across categories, shown on the right panel of Chart 3, mining and chemicals accounted for 43% of all Oklahoma’s imports in 2024, almost all due to large volumes of Canadian oil imports. The state has imported sizeable amounts of metals and machinery from other countries, but sources a relatively smaller share of transportation equipment and computer and electrical parts from abroad.
Overall, concentrations in durable goods exports and mining imports could leave pockets of the state’s economy exposed to shocks from trade disruptions. The rest of this article explores these areas of concentration and the health of Oklahoma’s manufacturing sector.
Chart 3: Most of Oklahoma’s exports are durable goods, particularly transportation equipment, while a considerable share of its imports are in mining.
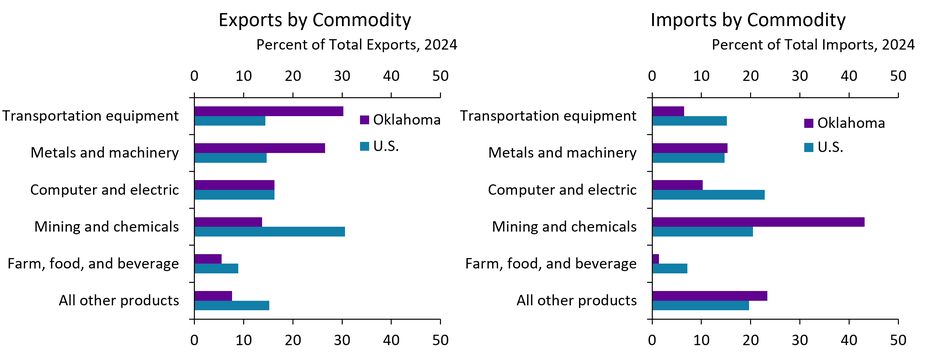
Note: The Mining category is mostly comprised of oil and gas commodities in Oklahoma.
Sources: U.S. Census Bureau (USA Trade), authors’ calculations
Two areas of concentration: aerospace exports and Canadian oil imports
Oklahoma’s international trade activity has exhibited greater volatility than the U.S. due, in part, to trade and market developments in key commodities. The state’s exports declined more than the U.S. in mid-2022 as oil prices fell from their peak, likely due to sectoral spillovers from dampened oil and gas activity. (Chart 4, left panel). In early 2024, exports grew at a much faster rate in Oklahoma than the national total before starting to decrease again in November. Despite recent declines, Oklahoma’s export dollar volume was still approximately 4% higher as of mid-2025 than it was at the beginning of 2024 on an inflation-adjusted basis.
Much of Oklahoma’s recent export growth was driven by aerospace products and parts, which accounted for over a quarter of the state’s total exports since 2024. Aerospace exports from Oklahoma averaged around $60 million each month from 2008 to 2022 but grew to $135 million by H2 2023 before peaking at $285 million in August 2024, four times higher than its historical average (Chart 5, left panel). This increase in aerospace exports has been broad-based across regions and countries of the world. Shipments to Europe first increased in the latter half of 2023, more than doubling from around $35 million in Q1 2023 to $81 million by year’s end (Chart 5, right panel). The following year in 2024, aerospace exports to Asia increased by two thirds from 2023 levels, and exports to the rest of the world more than doubled. While exports to these areas have fallen in 2025, aerospace products to the Middle East increased markedly, averaging $58 million a month in Q2 2025.
Chart 4: Oklahoma exports and imports have decreased somewhat in 2025.
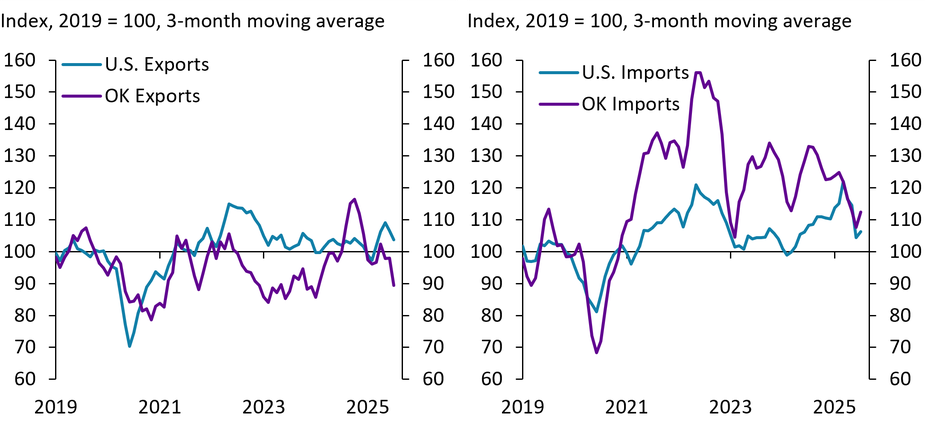
Note: Export and import dollar volumes adjusted to Consumer Price Index (CPI) inflation.
Sources: U.S. Census Bureau (USA Trade), U.S. Bureau of Labor Statistics (Haver Analytics), authors’ calculations
Chart 5: Oklahoma’s Aerospace exports have increased markedly since 2023.
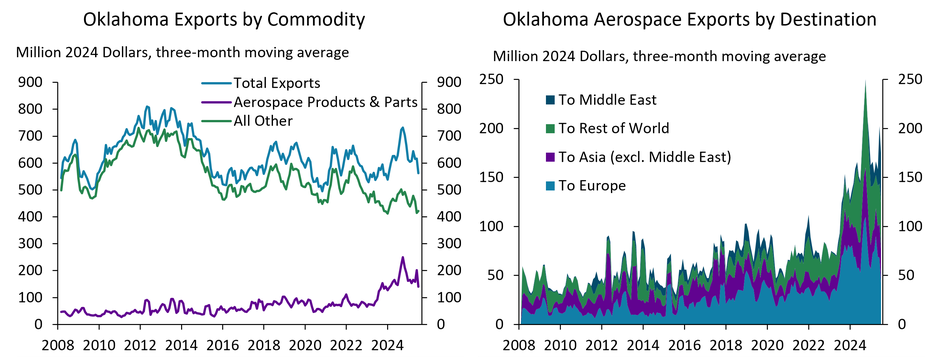
Note: Export dollar volumes adjusted to CPI inflation.
Sources: U.S. Census Bureau (USA Trade), U.S. Bureau of Labor Statistics (Haver Analytics), authors’ calculations
Import volumes generally vary more than export volumes, particularly in Oklahoma. For example, the state’s imports grew 16% from 2021 to 2022, while the state’s exports remained relatively more constant (Chart 4). Imports have declined in both the U.S. and Oklahoma in 2025 but rebounded modestly in recent months.
Much of the volatility in Oklahoma’s imports—and to a lesser extent, the nation’s—has coincided with changes in the dollar volume of Canadian oil imported, which has comprised a considerable share of the state’s total imports. The movement in Oklahoma’s total imports largely has tracked changes in oil prices, rising sharply in 2021 and H1 2022 as oil prices climbed before falling in H2 2022 when prices declined. The state’s imports were somewhat steadier when adjusting them for Canadian oil prices, especially in 2021 and 2022. Even when adjusting for prices, Canadian oil still made up a significant share of Oklahoma’s total imported commodities. Although Canadian oil imports declined slightly in the past five years, they still averaged 40% of monthly imports since 2021 (Chart 6).
Chart 6: Canadian oil & gas makes up 40% of Oklahoma’s imports.
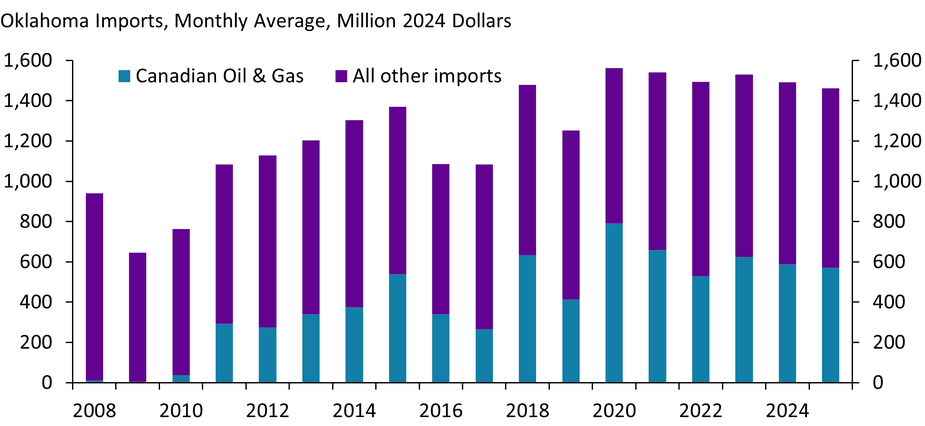
Note: Canadian Oil & Gas imports adjusted to Western Canada Select (WCS) oil price. All other imports adjusted to CPI inflation.
Sources: U.S. Census Bureau (USA Trade), U.S. Bureau of Labor Statistics (Haver Analytics), Alberta Energy, authors’ calculations
Oklahoma is one of many Midwestern states that imports considerable volumes of oil from Canada. According to Brown and Beckemeyer (2025), refineries in the Midwest are uniquely equipped to refine Canadian oil specifically, a heavy sour crude oil which requires more extensive processing than domestically sourced light sweet crude. Because of this, 73% of all Midwestern refineries’ crude inputs in 2024 were sourced from Canada, and over 70% of all Canadian oil imported into the U.S. was refined in the Midwest._ As such, increases in Canadian oil prices—including from tariffs—could lead to higher prices for gasoline and other refined petroleum products in the Midwest (Brown and Beckemeyer 2025).
Oklahoma’s manufacturing sector has grown this year, but could face some sectoral risk from international trade exposures
Manufacturing employment has lagged total employment since 2020 but has risen recently. Although Oklahoma’s total job growth has followed the same track as the nation, Oklahoma’s manufacturing job growth was slower from 2020 to mid-2023 (Chart 7, left panel). Since 2023, however, U.S. manufacturing job growth has declined slightly, while gains leveled off in Oklahoma before ticking up in recent months.
Recent growth in Oklahoma manufacturing employment was supported by gains in durable and nondurable manufacturing subsectors. In Oklahoma, jobs in nondurable manufacturing—which includes items like food, fuel, and paper products and made up a third of all manufacturing jobs in the state in 2024—recovered quickly from the pandemic, outpacing growth for U.S. nondurable manufacturing employment and jobs in durable goods manufacturing in Oklahoma (Chart 7, right panel). Employment growth in Oklahoma durable goods manufacturing—which includes products with a longer lifespan like machinery, transportation and HVAC equipment, appliances, and furniture—has lagged the nation and nondurable goods manufacturing in the state. In recent months, however, jobs in both durable and nondurable goods manufacturing have grown in Oklahoma, even as growth in the nation slowed in both categories.
Chart 7: Manufacturing employment has been mostly flat since 2023, but has trended up in Oklahoma recently.
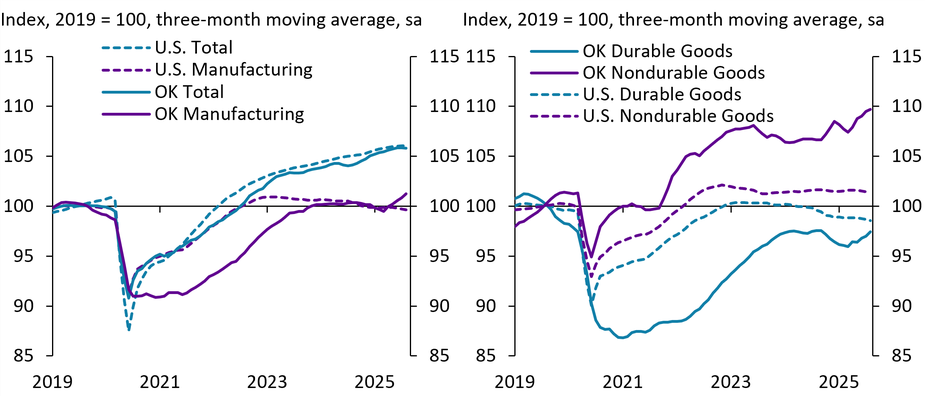
Sources: U.S. Bureau of Labor Statistics (Haver Analytics)
Although Oklahoma’s manufacturing sector has grown this year, the sectoral composition of its employment may leave it exposed to risks from international trade disruptions. Two thirds of the state’s manufacturing employment was concentrated in its top six sectors in 2024, as shown in Table 1. All but one of the top sectors relate to durable equipment, machinery, and metal manufacturing. These sectors each export a greater share of their output and import a greater share of their raw materials than the median goods-producing sector in the United States (shown by red shading in Table 1)._ For example, transportation equipment—which is mostly aerospace manufacturing in Oklahoma—was the state’s top manufacturing sector by employment in 2024. Oklahoma was twice as specialized in transportation equipment employment than the nation_, and the sector exported 40% of its output on average in the U.S. while it sourced 35% of its raw materials from abroad. Further, aerospace manufacturers in Oklahoma tend to have a more concentrated set of trading partners, theoretically limiting their ability to substitute partners in the event of a trade disruption (McCoy 2025). Oklahoma’s concentration in these trade-heavy sectors could cause headwinds to employment in the event of trade disruptions and price shocks heading forward.
Table 1: Oklahoma’s manufacturing employment is concentrated in sectors which are heavily exposed to international trade.
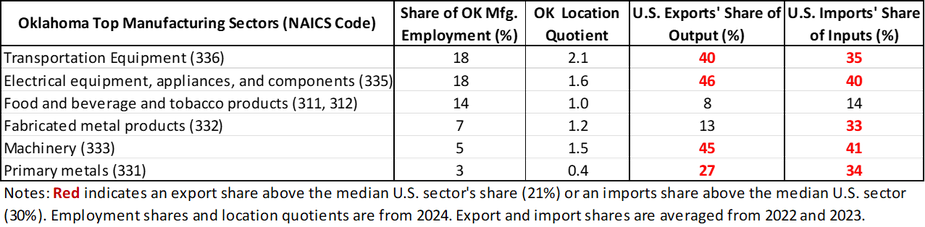
Sources: U.S. Census Bureau (USA Trade), U.S. Bureau of Labor Statistics (Haver Analytics), U.S. Bureau of Economic Analysis, McCoy and Kauffman (2025), authors’ calculations
Summary and Conclusions
International trade activity in Oklahoma is relatively limited, but a few key sectors produce goods which often rely on trade abroad for procuring inputs and selling outputs. The state’s exports have been focused on durable goods, particularly metals, machinery, and transportation equipment. Aerospace products and parts, in particular, are a large fraction of exports and have driven growth in recent years. Oklahoma’s imports have more closely resembled the national average, but are concentrated in crude oil sourced from Canada, which could leave the state and broader Midwest region exposed to higher gasoline prices in the event of higher prices for Canadian crude oil. Manufacturing employment in Oklahoma has remained fairly stable, even ticking up in recent months, but has concentrations in durable goods sectors which rely on international trade. While Oklahoma is broadly insulated from trade disruptions, the impact to the state likely depends on the adaptability of its producers’ supply chains and evolving market conditions.
The views expressed are those of the authors and do not necessarily reflect the positions of the Federal Reserve Bank of Kansas City or the Federal Reserve System.
Endnotes
-
1 Commodity category aggregations shown in Chart 3 consist of the following 3-digit NAICS codes. Farm, food, and beverage includes NAICS 111, 112, 113, 114, 1115, 311, and 312. Mining and chemicals: 211, 212, 324, 325, 327. Metals and machinery: 331, 332, 333. Computer and electric: 334, 335. Transportation equipment: 336. All other products: 313, 314, 315, 316, 321, 322, 323, 326, 337, 339, 511, 512, 910, 920, 930, 980, 990.
-
2 The Midwest refers to the Midwest PADD (External LinkPetroleum Administration for Defense District), which includes Oklahoma.
-
3 See McCoy and Kauffman (2025) for detailed methodology for the calculation of exports’ share of output and imports’ share of inputs.
-
4 Oklahoma’s specialization is calculated by the location quotients shown in Table 1. The location quotient is a ratio of two ratios which calculates Oklahoma’s specialization in a sector relative to the U.S. The numerator ratio is employment in a given sector in Oklahoma over total employment in Oklahoma. The denominator ratio is employment in a given sector in the U.S. over total employment in the U.S. Thus, a ratio greater than 1 indicates that Oklahoma’s employment is more specialized in a sector than the U.S.
References
Brown, Jason and Bobby Beckemeyer. 2025. “External LinkCanadian Oil Important for Midwest Gasoline
External LinkPrices.” Federal Reserve Bank of Kansas City, Economic Bulletin, May 9.
Budget Lab at Yale, The. 2025. “External LinkState of U.S. Tariffs: September 26, 2025.” Yale University,
September 26.
McCoy, John. 2025. “Changes in International Trade Could Disproportionately Affect
Employment in Pockets of the Tenth District.” Federal Reserve Bank of Kansas City, Economic Bulletin, July 7.
McCoy, John and Nate Kauffman. 2025. “Labor Market Risk Associated with Trade Uncertainty
More Limited in Nebraska.” Federal Reserve Bank of Kansas City, Nebraska Economist, April 18.
The views expressed are those of the authors and do not necessarily reflect the positions of the Federal Reserve Bank of Kansas City or the Federal Reserve System.
Authors

Cortney Cowley
Assistant Vice President and Oklahoma City Branch Executive