The views expressed in this paper are those of the author and do not necessarily represent those of the Federal Reserve Bank of Kansas City or the Federal Reserve System.
Introduction
Very few events in history have had as much an effect on human life and the economy as the COVID-19 pandemic. When the virus first emerged, public health authorities and government leaders enacted policies to curtail transmission and consumers reduced their activity in public spaces such as restaurants. Schools switched to online learning. Offices emptied as employers had many employees work from home. Travel halted abruptly, leading to hotel closures and cancelled flights. Restaurants shifted to take-out only or closed completely. Millions across the U.S. became unemployed in the largest mass layoff since the Great Depression. Disproportionate effects were felt especially in low-wage jobs, affecting many women and people of color.
As people lost jobs, the hit to their finances affected their ability to pay for housing. Low-income workers are more likely to be renters than to own a home. Thus, a widescale economic shutdown that disproportionately affected low-wage workers created a significant hurdle to paying rent on time and in whole. Homeowners have many protections and opportunities to avoid falling into foreclosure, but renters have few, if any, protections. Some local governments established eviction moratoriums. These later were replaced or modified by a nationwide eviction moratorium by the Centers for Disease Control (CDC). The current moratorium expires Oct. 3, 2021, and applies only to counties with substantial transmission of COVID-19. About 85% of counties in the Federal Reserve’s Tenth District are covered by the order. The intent of the moratorium is to stop evictions and prevent overcrowding in houses or homeless shelters where COVID-19 could spread rapidly._
This report examines the pandemic’s effect on jobs, housing, and evictions throughout the Tenth District, which covers Colorado, Kansas, western Missouri, Nebraska, northern New Mexico, Oklahoma and Wyoming. Some states in the District have weathered the pandemic’s economic effect relatively well, while recovery has lagged in others. And while most District states received ample funds for rental assistance from congressional relief efforts, the biggest struggle has been getting money to those in need. A lack of data makes it difficult to estimate how many people may be at risk of eviction or who already have been evicted throughout the pandemic. Using data from the U.S. Census Bureau’s Household Pulse Survey, I estimate that low-income renters across the District potentially owe nearly $2.5 billion in back rent and utilities.
COVID-19 and Job Loss
Applications for unemployment benefits peaked nationally at over 32 million workers in June 2020 and have declined slowly since (Chart 1). This number does not include people who were unemployed but did not apply for benefits or those who remained ineligible even after the Coronavirus Aid, Relief, and Economic Security Act (CARES) expanded eligibility.
Chart 1: Unemployment Claims throughout the Pandemic
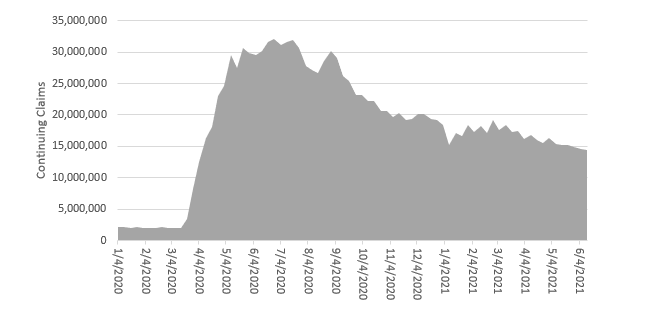
Note: Data represent continuing claims only for state regular unemployment, pandemic unemployment assistance and pandemic emergency unemployment compensation programs.
Source: U.S. Department of Labor
However, job losses were not distributed equally. Overall, people of color, low-income workers and women were most likely to experience a pandemic-related job loss.
Who Lost?
Across the Tenth District, every population group experienced a large drop in employment-to-population ratio (EPR) in the first quarter of 2020 (Chart 2)._ By September 2020, non-Hispanic white workers had recovered nearly fully to the same EPR relative to January 2020. Non-Hispanic people of color experienced the longest pattern of employment losses. Their EPR did not start to improve until January 2021. Meanwhile, Hispanic workers experienced the largest drop in EPR (13 percentage points), but they recovered about half their employment losses by June 2020. Since then, Hispanic EPR has not improved.
Chart 2: Tenth District Employment-to-Population Ratio by Race/Ethnicity
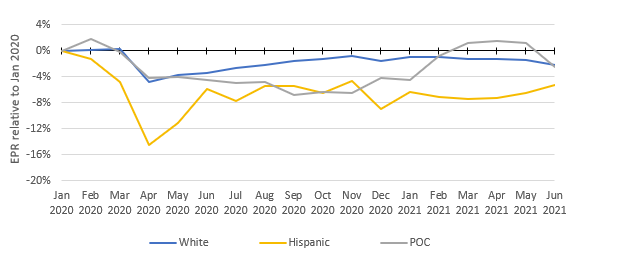
Note: Analysis was restricted to populations aged 25-64; Data includes the full states of Missouri and New Mexico. Change in employment to population ratio (EPR) is indexed to January 2020.
Sources: Current Population Survey; IPUMS-CPS, University of Minnesota, www.ipums.org
Some economists are calling the pandemic recession a “shecession,” due to women with children experiencing job losses disproportionate to men._ Chart 3 shows mothers in the Tenth District either lost jobs or left the labor market at a much higher rate than fathers early in the pandemic. Fathers fared the best of any gender group, but their employment rate has not improved much since the initial job losses. Fathers likely fared better due to women leaving work to take care of their children who were learning from home. By November 2020, there was little disparity between fathers and mothers in their employment impact from the pandemic. Both gender groups’ EPR remains about 2 percentage points below January 2020. About 7% of childless workers experienced employment losses as well. Childless women seem to have recovered most of their employment losses while only 3% of childless men have returned to work.
Chart 3: Tenth District Employment-to-Population Ratio by Gender and Parental Status
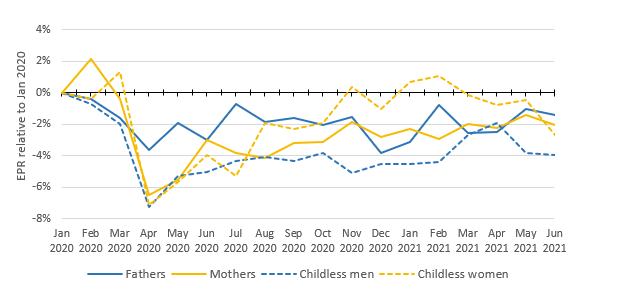
Note: Analysis was restricted to populations aged 25-64; Households with children have at least one non-householder who is 18 years or younger. Data includes the full states of Missouri and New Mexico. Change in employment to population ratio (EPR) is indexed to January 2020.
Sources: Current Population Survey; IPUMS-CPS, University of Minnesota, External Linkwww.ipums.org
Job losses also disproportionately affected low- and moderate-income (LMI) populations. In this analysis, workers were counted as LMI if they lived in a family with an income of less than 80% the median family income of the District (about $50,000)_. Nearly 9% of LMI workers lost their jobs at the beginning of the pandemic and less than half have returned to work (Chart 4). Meanwhile, nearly 80% of non-LMI workers have returned to work.
Chart 4: Tenth District Employment-to-Population Ratio, LMI Workers
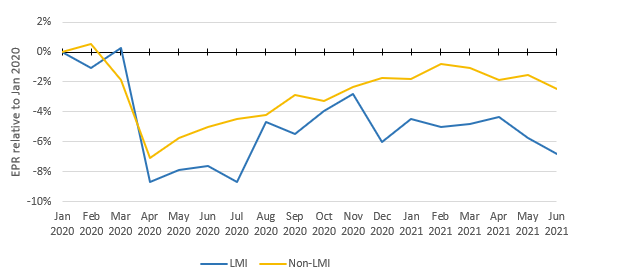
Note: LMI is defined as a family earning 80% or less of the median area income. For the District in this dataset, LMI = less than $50,000. Anlysis was restricted to populations aged 25-64; Data includes the full states of Missouri and New Mexico. Change in employment to population ratio (EPR) is indexed to January 2020.
Sources: Current Population Survey; IPUMS-CPS, University of Minnesota, External Linkwww.ipums.org
The job losses experienced by LMI workers and people of color can be traced to their high share of employment in industries that were affected significantly by the pandemic. Chart 5 shows workers in the leisure and hospitality sector were the most likely to lose their jobs. Leisure and hospitality also is the industry with the highest proportion of workers who are low-wage and identify as people of color. The other services sector is a relatively vague industry classification, that includes several industries that have disproportionately high shares of low-wage workers and workers of color. They worked in industries that were highly disrupted by the pandemic, such as personal care firms (barber shops and nail salons), dry cleaning, laundry services and auto repair shops. With the pandemic still weighing on some businesses, it is likely low-wage workers and people of color will continue to see a slower recovery than other population groups. The slow recovery for those workers is likely to continue to affect their housing situation.
Chart 5: Tenth District Leisure and Hospitality and Other Services Sectors Affected Most by Pandemic and Still Lag All Other Industries
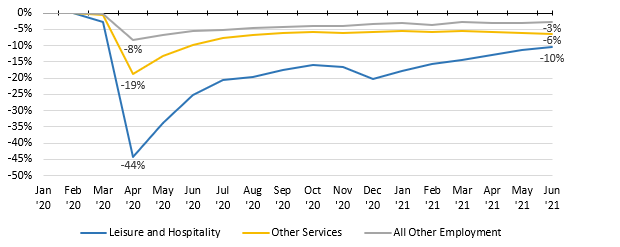
Note: Data includes the full states of Missouri and New Mexico.
Source: Bureau of Labor Statistics/Haver Analytics
Housing
Pre-Pandemic Housing Situation
While the 2008 housing crisis led to large number of foreclosures, there has been more immediate concern about evictions during the pandemic recession. One reason for that concern is the lost jobs and slower recovery in the service sectors experienced by low-wage workers and people of color.
Low-income populations tend to struggle to save for down payments for purchasing a house, qualifying for mortgages and finding houses for sale that they can afford. As such, they often turn to renting. Across the District, about three-quarters of households earning less than $35,000 a year were renters compared with about half of those earning over $35,000 a year (Chart 6).
Chart 6: Low-income Households more likely Renters than Owners
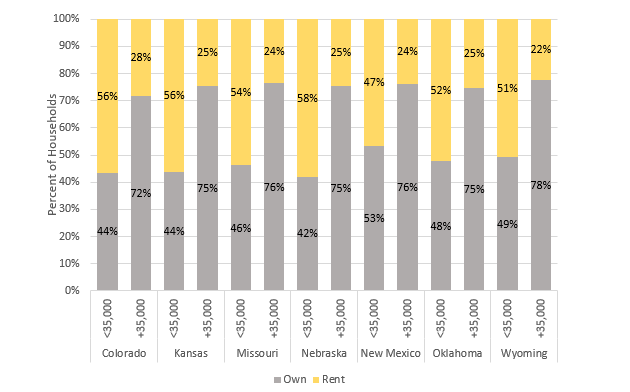
Note: Missouri and New Mexico data are for the full state.
Sources: American Community Survey, 5-year estimates, 2019; IPUMS-USA, University of Minnesota, External Linkwww.ipums.org.
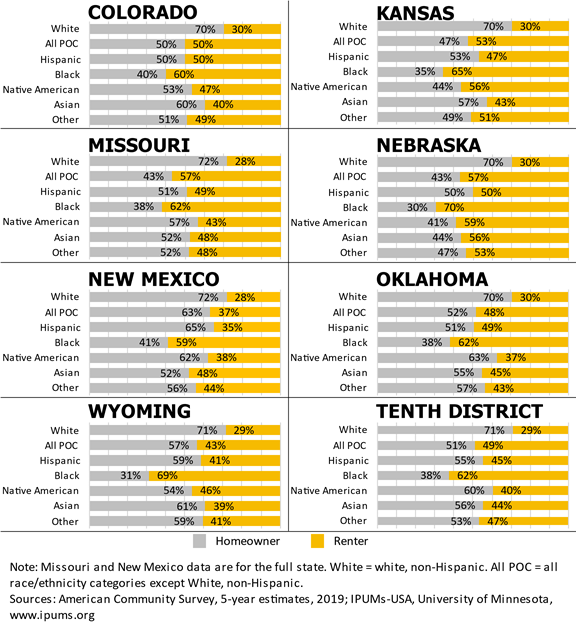
Where people of color live and whether they rent or own is influenced heavily by inequality in wages and education and continued discrimination in both employment and housing._ As a result of these barriers to homeownership, 62% of Black households in the District were renters in 2019 (Chart 7). Overall, people of color were split about evenly between owning and renting whereas 70% of white households were owners. In the District, only in New Mexico did people of color only have homeownership rates above 60%.
Chart 7: Households of Color More Likely Renters than White Households
In addition to being much more likely to lose a job, people with low incomes and people of color also are also more likely to be threatened with eviction given that they are more likely to be renters than higher-income and white households. Part of understanding the threat of eviction is understanding renters’ financial situation. Generally, banks act as gatekeepers to home ownership by setting standards on affordability and denying loans for people who may not be able to afford them. For renters, there is no similar oversight of affordability, other than an individual landlord’s discretion. And given few other options, tenants will stretch their budget as far as possible to keep a roof over their heads.
Seventy-nine percent of renter households earning less than $35,000 a year spend more than 30% of their income on rent and utilities (Chart 8)._ Nearly 90% of renter households earning less than $20,000 a year spend more than 50% of their income on rent and utilities. The housing burden among low-income households makes many aspects of life difficult. But when faced with a job loss and little opportunity to find new employment, such as during the early months of the pandemic, it is easy to see why so many renters fell behind on rent.
Chart 8: Renter Household Income Spent on Rent by Percent of Income
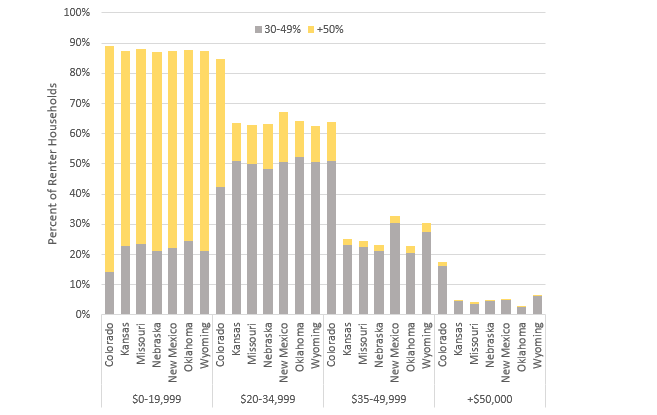
Notes: Missouri and New Mexico data are for the full state. Households with zero or negative income were excluded from analysis.
Sources: American Community Survey, 5-year estimates, 2019; IPUMS-USA, University of Minnesoata,External Linkwww.ipums.org.
Evictions
In September 2020, the CDC issued a nationwide eviction moratorium effective through July 31, 2021._ Following the expiration of that moratorium, the CDC extended it until Oct. 3, 2021, for counties that had substantial rates of COVID-19 transmission. Counties are covered by the order if their COVID-19 transmission exceeds 50 cases per 100,000 people or their positive test rate exceeds 8%. Based on that criteria, as of Aug. 4, about 85% of counties across the District were covered by the new moratorium. While the CDC’s intent was to stop evictions to help prevent the spread of COVID-19, the order was not a complete prevention of evictions. Across the country, courts and landlords interpreted the order in different ways and many have proceeded with eviction cases.
Unfortunately, data on evictions are not readily available. Eviction data are captured through court records, and there is no centralized system that collects and standardizes that information. Not all jurisdictions expend the resources to collect and prepare the data for analysis purposes, and as such there is limited coverage and availability. Across the Tenth District, eviction data are readily available only for Kansas City (KCMO) and Oklahoma.
Despite the moratorium, eviction filings have continued at the very least in Kansas City, Oklahoma City (Oklahoma, Cleveland and Canadian counties) and Tulsa (Tulsa County) (Chart 9). Although courts essentially closed early in the pandemic, a sharp rise in eviction filings indicated they reopened to some extent as the pandemic wore on. The CDC order appeared to level off the rise in eviction filings. While eviction filings remain lower than they were pre-pandemic, the eviction filings represent thousands of households each month that either go to court to keep their home or must find somewhere else to live._
Chart 9: Monthly Eviction Filings for Select Counties in Oklahoma and Kansas City, Missouri
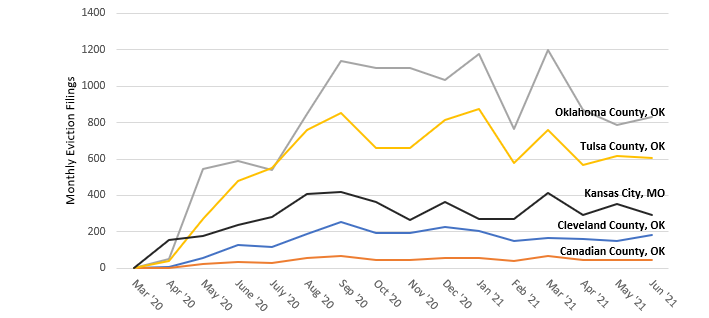
Note: October 2020 data for counties in Oklahoma were imputed due to missing data.
Sources: Open Justice Oklahoma; Eviction Lab.
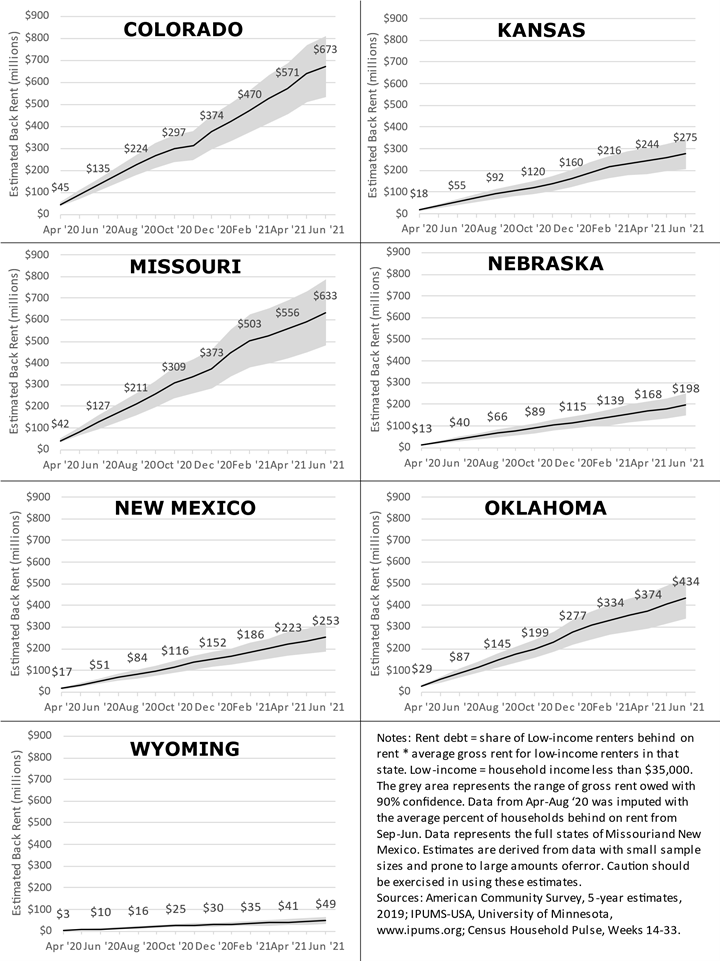
Although some evictions have continued, it also is likely that the eviction ban has limited that number and that the expiration of the ban could lead to a surge in filings. Using the U.S. Census Bureau’s Household Pulse Survey, I can estimate how many renters are behind on rent, therefore putting them at potential risk of eviction._ From September 2020 to April 2021, the percent of low-income renters across the District stating they were behind on rent has varied between 10-20% (representing about 160,000-260,000 households)._ The estimated cumulative amount of rent debt by state is shown in Chart 10. I estimate low-income renters in the District may owe about $2.5 billion in rent and utilities from 14 months of the pandemic._ While Chart 10 shows low levels of rent debt for some states, the figures largely are representative of the state population.
Chart 10: Estimated Cumulative Rent Debt for Low-income Rental Households
Missed rent also is affecting landlords. Most landlords own between one and four units. A single renter unable to pay may limit a landlord’s ability to provide timely and adequate maintenance or pay an existing mortgage on the building. Avail, a property management software company associated with small landlords, has surveyed their users several times during the pandemic. In their May 2021 report, over 41% of landlords reported financial losses due to missed or late rent payments in the last three months._ That compares with 61% who reported financial losses between March 2020 and February 2021. While the situation is improving, landlords still are under stress, and that stress is spilling into their operations. Twenty-eight percent of landlords reported deferring maintenance and most of those deferred due to financial reasons. Largely due to the financial losses from nonpayment of rent, nearly 31% of landlords in Avail’s October survey were considering selling their property._ While rental assistance now is available widely, many landlords already had experienced 10 months or more of financial pressure. The sale of their property could mean a loss in rental units or increased rent affecting the overall supply of affordable housing.
Congress has appropriated over $46 billion for rent relief, of which Tenth District states received $3.3 billion. The money may be used to pay up to 12 months of back rent and three months of rent into the future. And while this amount is more than enough to cover the estimated $2.5 billion of rent due, money has been very slow to reach renters and landlords that need it._ As such, concerns about an eviction surge remain valid. Employment is not back to pre-pandemic levels, and returning to work likely will help only so much given that many low-income renters were struggling to afford rent pre-pandemic. It is unlikely they will be able to make payments on past-due rent on top of continued rent payments. To stem evictions it likely will be critical that the rent relief money gets to renters as soon as possible. It also is important, however, to recognize the evictions issue is not new. In Eviction Lab’s 2016 analysis of evictions data across the country, District cities ranked relatively high in rates of evictions: Tulsa (11th), Oklahoma City (20th), Kansas City (31st) and Omaha (72nd). Denver, in contrast, ranked 127th.
What's Next?
Understanding the housing challenges experienced by low-income households is only the beginning. It is important to focus on what is next. Low-income renters are likely to continue to struggle to find an affordable place to live. Renters with evictions on their rental records may be excluded from some housing options and face greater difficulty in finding suitable housing options. Many renters also are likely to struggle under the additional burden of trying to make payments on past due rent because they didn’t receive rent relief, either because of ineligibility or being unaware of its availability. Further, it remains unclear how long unemployment will remain relatively high, especially for Black and Hispanic workers. There are many ways cities, counties and states may address the eviction issue in the short and long terms.
In the short term, cities, counties and states operating rent relief programs will have to work to overcome bottlenecks in the distribution of aid. A nationwide survey of rent relief programs suggested the top issues preventing money from being distributed quickly were staff needed to process paperwork and tenant and landlord responsiveness._ In particular, both issues were mentioned as reasons why Kansas City has been slow to provide assistance. In Kansas City, the rental assistance program has closed to new applicants after receiving more than 7,000 applications and providing assistance to about 1,100 so far._ Applicants still may turn to the state rental assistance program, which has much more money available, but state programs face similar difficulties in distributing aid.
To address slow distribution of rent relief dollars, the U.S. Treasury updated guidance for rent relief programs using money from the American Rescue Plan Act (passed in March 2021)._ The biggest update requires programs to offer rental assistance directly to tenants when landlords decline to participate. The update also shortened the waiting period for a landlord response to seven days if contacted by mail or five days if contacted by phone, text, or email. This may reduce at least one of the barriers to getting money out quickly.
For additional information on best practices for emergency rental assistance programs see:
- External LinkWhite House suggestions
- External LinkU.S. Justice Department suggestions for courts
- External LinkLessons learned from 15 emergency rental assistance program case studies
Evictions are likely to remain a persistent issue for low-income renters even when the financial pressures of the pandemic have passed. Most communities have few programs in place to help renters stay in their homes when confronted with the possibility of eviction. There are policies that cities and counties may consider to reduce the number and economic effect of evictions. These policies may include:_
- Eviction mediation programs – offer a pre-filing meeting between landlord and tenant with a professional mediator. The goal is to negotiate an agreement that works well for both parties.
- Eviction diversion programs – multipronged effort that works to provide as much assistance as possible to prevent someone from having to leave their home such as robust rental assistance programs, legal support and mediation requirements.
- Tenant right to counsel – enacting a policy that tenants have a right to free legal counsel to represent them in eviction cases. Where it has been enacted, tenants have significantly improved outcomes in eviction cases. It does not necessarily mean the tenant avoids paying back-rent. Having legal counsel provides a tenant support in navigating the legal system, accessing available resources, learning their rights as a tenant and leverage to negotiate before being removed from their home.
This is far from a comprehensive list of options available to communities wanting to act to lessen the effect of evictions. No solution is easy, and they often cost money. However, preventing an eviction often leads to public savings._ People who are evicted have a higher likelihood of seeking services for homelessness and medical care._ They also have a higher likelihood of interacting with child welfare services and the criminal justice system.__ Researchers at the University of Arizona have developed a Cost of Eviction Calculator for communities to estimate how much money they could save on public services by preventing evictions._
Government agencies also can work to address larger economic issues that lead to evictions. In many communities across the country the demand for affordable housing far exceeds the available supply. Government funds allocated for affordable housing have not made up the difference. For instance, funding levels for the U.S. Department of Housing and Urban Development’s (HUD) Section 8 housing choice voucher program only cover about 25% of the people eligible for vouchers._ Even receiving a voucher is not a total solution as it often is difficult to get landlords to accept them._
Housing affordability also is related to the earnings potential of workers, which in turn is affected by minimum wage policies at the federal, state and local levels. The federal minimum wage last was raised in 2009 to $7.25 an hour. Many states have set their own minimum wage higher than the federal level, but the wage level still is inadequate in many cases.
Missouri’s minimum hourly wage is set to increase in 2023 to $12, such that a single adult working full time at that wage would earn about $25,000 a year before taxes. Based on HUD’s affordability level, a worker with this income reasonably could afford a monthly rent of $625. However, in 2019, low-income renters in the Kansas City metro were spending, on average, about $780 a month on rent and utilities._ The minimum wage in Denver is increasing to $15.87 an hour in 2022 and will continue to increase by the annual change in local inflation. In 2022, a full-time, minimum-wage earner in Denver could afford an apartment costing $825 a month. However, in 2019, low-income renters in the Denver metro were spending, on average, about $1,145 on rent and utilities. While the higher minimum wage does not sufficiently make up for the higher housing costs, indexing the minimum wage to inflation could help keep the gap from growing as fast. While wages struggle to keep up with rent, apartment prices have continued to increase. A recent report by Zillow found rents in Kansas City’s least expensive ZIP codes were increasing three times faster year over year than rents in the most expensive ZIP codes (6.9% vs. 2.2%)._
Conclusion
Evictions are deeply tied to affordable housing issues, a longstanding problem the pandemic served to highlight. Low-income workers and people of color lost jobs at much higher rates than other population groups. This made them much more vulnerable to falling behind on rent. Even though the CDC enacted a nationwide eviction moratorium, evictions continued. Congress provided a significant amount of money to make up for the debt that low-income renters have accrued due to losing their jobs, but that money has been slow to reach them. While the eviction moratorium was extended until October for most places, court challenges could end it early. This could put many renters in a tenuous position when rental assistance still has not reached them. Cities, counties and states can take some immediate actions to try to prevent that from happening, but larger efforts will need to occur to prevent evictions from being a persistent problem into the future.
Endnotes
-
1 The stated intent of the order follows with what they purportedly are allowed to do as a health authority. Certainly, there is broader benefit, as keeping people in their homes during a rapid recession could stave off broader economic and social problems, but that would be a reasoning possibly beyond the legal purview of the CDC. The intent of the order can be found External Linkhere.
-
2 I use EPR here because the measure better captures both workers who were unemployed and those who dropped out of the labor force.
-
3 Titan Alon, et. al. (2021). “From Mancession to Shecession: Women’s Employment in Regular and Pandemic Recessions.” External Linkhttps://www.nber.org/papers/w28632
-
4 The LMI threshold family income was calculated using the Current Population Survey data for the Tenth District. This value is likely to differ with a different data set.
-
5 There is a significant amount of literature covering this topic. These are some of the more influential sources: Desmond, M. (2016). “Evicted: Poverty and Profit in the American City”; Rothstein, R. (2017). “The Color of Law: A Forgotten History of how Our Government Segregated America”; Sharkey, P. (2013). “Stuck in Place: Urban Neighborhoods and the End of Progress toward Racial Equality.”
-
6 The U.S. Department of Housing and Urban Development states that a household spending more than 30% of their income on housing is considered housing burdened.
-
7 The CDC issued a federal eviction moratorium in September 2020. The order barred people from being evicted for past due rent provided they assert through a declaration form to their landlord that they were financially impacted by the pandemic. The order has been extended multiple times, but the most recent order extended it to July 31, 2021, and is stated to be the last extension. More information on the order can be found at External Linkhttps://www.cdc.gov/coronavirus/2019-ncov/covid-eviction-declaration.html
-
8 Eviction Lab collected data across much of the U.S. in 2016 that provides a baseline idea of what eviction rates were like pre-pandemic. Filing rates are about 40% of pre-pandemic levels in Kansas City, but about 80% in Tulsa and about 100% in Oklahoma City. Eviction Lab, External Linkhttps://evictionlab.org/
-
9 The Household Pulse Survey was started to capture relatively high-frequency data on people’s experiences during the pandemic. The survey has a small sample size, which leads to reliability issues, especially when examining a small population group such as racial categories. A lot of caution goes with using and reading the data, but with few other data options, it is still worthwhile to explore.
-
10 These data will not line up with American Community Survey estimates of the percent of low-income renters. The reliability issues of the data meant that each survey period also had a different estimate of the total number of renters. The percentages reported here are relative to those totals and meant to be illustrative rather than precise.
-
11 Estimated rent owed = percent of households stating they were behind on rent * average gross rent for low-income renters. This is a very rough estimate and is meant for illustration. I estimated the amount with gross rent rather than contract rent alone because of the additional error added by using contract rent from the American Community Survey. It is also reasonable to assume that someone struggling to pay rent is struggling to pay for utilities. The calculation assumes someone behind on rent has not paid anything toward their rent, suggesting that this estimate could be something of an upper bound.
-
12 Avail. (May 2021). “Landlords and Renters have Hope for Financial Revival as COVID-19 Pandemic Subsides.” External Linkhttps://www.avail.co/blog/landlords-and-renters-have-hope-for-financial-revival-as-covid-19-pandemic-subsides
-
13 Avail (October 2020) “Missed Rent, No Government Aid and the Pressure to Sell; What Renters and Landlords are Facing During COVID-19.” External Linkhttps://www.avail.co/blog/missed-rent-no-government-aid-and-the-pressure-to-sell-what-renters-and-landlords-are-facing-during-covid-19
-
14 Multiple news sources have reported on the slow rollout of rental assistance money across the country. In Missouri, the Missouri Independent reported on it in early May. External Linkhttps://missouriindependent.com/2021/05/17/advocates-fear-homeless-crisis-with-federal-eviction-moratorium-on-shaky-legal-ground/
The New York Times reported on the issue nationally in April. External Linkhttps://www.nytimes.com/2021/04/25/us/politics/rental-assistance-pandemic.html
-
15 National Low-Income Housing Coalition. (2021). Analysis of National Survey of Treasury Emergency Rental Assistance Programs. External Linkhttps://nlihc.org/sites/default/files/HIP_NLIHC_Furman_2021_6-22_FINAL_v2.pdf
-
16 Celisa Calacal (July 19, 2021). “’I’m going to lose it all’: Tenants left in the dark as KC’s rental assistance program closes to new applicants.” The Beacon. External Linkhttps://thebeacon.media/stories/2021/07/19/kansas-city-rental-assistance-closed/
-
17 U.S. Department of the Treasury. (May 7, 2021). Emergency Rental Assistance Fact Sheet External Linkhttps://home.treasury.gov/system/files/136/FACT_SHEET-Emergency-Rental-Assistance-Program_May2021.pdf
-
18 A brief overview of some eviction prevention programs: National League of Cities. (2020). “Long-term Approaches to Preventing Evictions Now and Beyond COVID-19.” External Linkhttps://www.nlc.org/article/2020/08/07/long-term-approaches-to-preventing-evictions-now-and-beyond-covid-19/
-
19 National Low-Income Housing Coalition. (2020). “Cost of COVID-19 Evictions.” External Linkhttps://nlihc.org/sites/default/files/costs-of-covid19-evictions.pdf
-
20 Collinson, R., and Reed, D. (2018). The effects of evictions on low-income households. External Linkhttps://www.law.nyu.edu/sites/default/files/upload_documents/evictions-collinson_reed.pdf.
-
21 Bullinger, L.R., and Fong, K. (2021). “Evictions and Child Maltreatment Reports.” Housing Policy Debate, 31(3-5): 490-515.
-
22 Herring, C., Yarbrough, D., and Alatorre, L.M. (2020). “Pervasive Penalty: How the Criminalization of Poverty Perpetuates Homelessness.” Social Problems, 67: 131-149.
-
23 University of Arizona. (2020). Cost of Evictions Calculator. External Linkhttps://uarizona.neotalogic.com/a/costofevictioncalculator
-
24 Center on Budget and Policy Priorities. (2021). “Policy Basics: The Housing Choice Voucher Program.” External Linkhttps://www.cbpp.org/research/housing/the-housing-choice-voucher-program
-
25 U.S. Department of Housing and Urban Development. (2018). “A Pilot Study of Landlord Acceptance of Housing Choice Vouchers.” External Linkhttps://www.huduser.gov/portal/portal/sites/default/files/pdf/Landlord-Acceptance-of-Housing-Choice-Vouchers.pdf
-
26 I used the American Community Survey, 1-year estimates, public-use microdata, for renters earning less than $35,000 a year and reported at least $50 gross rent; Data retrieved from: Steven Ruggles, Sarah Flood, Sophia Foster, Ronald Goeken, Jose Pacas, Megan Schouweiler and Matthew Sobek. IPUMS USA: Version 11.0 [dataset]. Minneapolis, MN: IPUMS, 2021. External Linkhttps://doi.org/10.18128/D010.V11.0
-
27 Chakrovorty, A. (March 8, 2021). ”Softening Rents Offer Uneven Respite for Renters.” Zillow Research.External Linkhttps://www.zillow.com/research/softening-rents-uneven-tier-29170/
The views expressed are those of the authors and do not necessarily reflect the positions of the Federal Reserve Bank of Kansas City or the Federal Reserve System.
Author