This issue of the Tenth District Consumer Credit Report begins with an analysis of average consumer debt and average revolving debt in the Tenth District and the United States. The analysis then explores how consumer debt in the District has evolved over time by type of debt. The discussion then turns to delinquency rates, which may be the best measure of consumer financial stress. Finally, the special topic in this issue examines how the capacity to pay off debt differs across states and counties in the District.
Average Consumer Debt
Among the most critical elements of financial well-being for individuals and families is their amount of consumer debt. Debt service (required payments for principal and interest) affects not only the ability of individuals and families to spend from current income, but also impedes their ability to save. Moreover, the level of debt one owes is an important factor in accessing credit both because it may raise debt-to-income ratios, which financial institutions often use as a measure of ability to repay, and levels of debt over time and ratios of debt relative to credit limit, which are considered in determining credit scores and overall credit standing.1 Average consumer debt provides significant insight into the debt burden of a typical individual.
Average consumer debt in the District, measured as all outstanding debt other than first mortgages and presented as an inflation-adjusted four-quarter moving average, was $17,698 in the first quarter of 2019, compared with $18,497 nationally. Typically, average consumer debt is lower in the District than in the nation. District average consumer debt rose about 5.8 percent from its post-recession low in 2012 through 2017 (1.1 percent annually) but since has leveled off (Chart 1). U.S. average consumer debt was flat between 2012 and 2017 and since then has declined at a modest annual rate of 0.3 percent.
Chart 1: Outstanding Consumer Debt per Consumer and Revolving Debt per Consumer
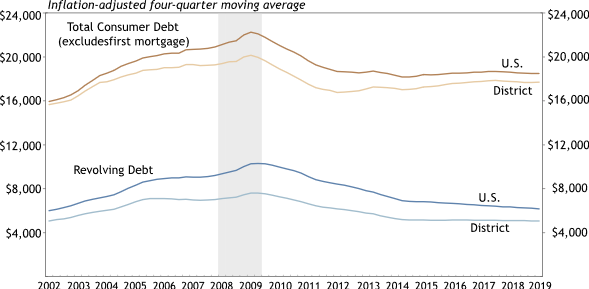
Notes: Excludes first mortgage. A first mortgage represents the primary note on a home and typically is not used to purchase consumer goods. Gray bar indicates recession.
Source: Federal Reserve Bank of New York Consumer Credit Panel/Equifax; staff calculations.
Revolving credit is an open line of credit. For consumers, revolving debt largely is credit cards and home equity lines of credit (HELOCs). Revolving debt has greater potential to cause problems for consumers than installment debt. For example, utilization rates on revolving accounts (debt relative to credit limit) are weighted heavily when determining credit scores, while installment loan balances typically are not a significant consideration (although growing balances can be). Utilization rates on HELOCs (43.5 percent nationally in the first quarter) tend to be significantly higher, on average, than utilization rates on credit cards (22.7 percent nationally in the first quarter). In addition, in common personal finance parlance, installment debt is more likely to be “good debt” while revolving debt is more likely to be “bad debt.”2 Installment loans such as mortgages and student loans often finance appreciating assets (a house or earning potential) or long-lived assets (such as a car or furniture), while credit cards and other forms of revolving credit often finance depreciating assets or consumables. In this sense, consistently declining levels of average revolving debt in the District (and the nation) since the recession is an encouraging trend. Average revolving debt in the District decreased 0.8 percent in the past year to $5,053 (Chart 1). U.S. average revolving debt decreased more sharply, from $6,324 to $6,163, or just over 2.5 percent.
Average consumer debt can be decomposed to provide additional insights into the average credit position of District consumers. Chart 2 shows inflation-adjusted average levels of debt for auto loans, bank cards and student loans for the District over time. The data reflect average balances for those who have positive balances. With the exception of student loans, there has been a general paring down of household balance sheets following the recession, especially through 2012.
Chart 2: Consumer Debt in the Tenth District Over Time, by Type of Debt (First Quarter)
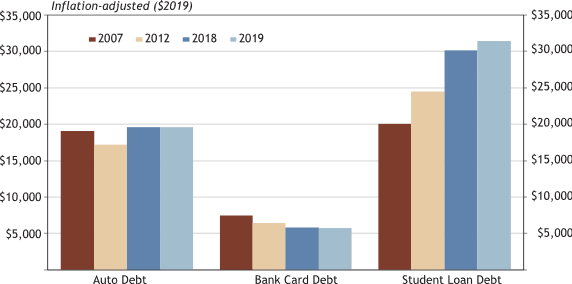
Sources: Federal Reserve Bank of New York Consumer Credit Panel/Equifax; staff calculations.
Average auto loan debt in the District reached its post-recession low in the second quarter of 2011 and steadily increased through the second quarter of 2017. Average balance, however, has declined moderately since (about 1 percent total). Still, average auto debt in the District remains well above the post-recession low. Adjusted for inflation, consumer expenditures on motor vehicles and parts increased nationally at an annual rate of 4.6 percent between 2012 and 2018.3 Aggregate auto debt has increased sharply since 2012, rising at an inflation-adjusted annual rate of 6.8 percent. But, consistent with comparatively much slower growth in average auto debt, the primary reason for this surge in aggregate debt is a significant increase in the number of borrowers.4 Currently, more than one-third of American consumers have an auto loan, compared with 20 percent in 1999. Still, average new loan amounts for both new and used cars were at record highs in the first quarter, and interest rates on new auto loans have increased.5
Bank credit card debt accounts for about two-thirds of all revolving consumer debt and is driving the overall downward shift in average revolving debt since the recession. As noted above, the average debt levels reported in Chart 2 include only individuals who have positive balances. In the 2018 Survey of Household Economics and Decision-Making (SHED), 47 percent of respondents with credit cards reported paying off their balance at the end of each billing cycle.7 But even if a consumer pays off credit cards at the end of the billing cycle, if the credit card is used during the month, the servicer will report a positive balance. If it were possible to report only balances for those who carry over debt on a regular basis, the average debt shown in Chart 2 likely would be much higher.
Student loan debt, conversely, has followed a different path, increasing at a continuous, relatively rapid rate since 2007. Average student loan debt in the District, adjusted for inflation, has increased 3.8 percent annually since 2007. The comparable national rate is 3.6 percent. Aggregate student loan debt, adjusted for inflation, has increased at an annual rate of 7.7 percent since 2007, but similar to auto loans, although to a lesser degree, the growth in aggregate student loan debt partly reflects an increase in the number of borrowers.7 About 18 percent of the population has student loans, compared with 10 percent in 2010.
Delinquency
Because they are an important part of determining credit scores, and a fundamental attribute of credit standing as viewed by financial institutions, delinquencies make accessing additional credit much more difficult, and many consumers have problems accessing credit. In the SHED survey, of those who applied for credit in the year preceding the survey, 23 percent were denied, and 8 percent were offered less than requested.8 The survey does not ask why the respondent was denied credit, but the results make it clear that access to credit is a significant hurdle for many consumers, often made worse by consumer credit delinquencies.
I construct measures of delinquency using the share of consumers with at least one account in the credit category (such as auto loans) who are 90 days or more past due on at least one account in that category. Thus, if a consumer has four credit card accounts, and one is delinquent while the others are current, the consumer is considered delinquent. As a result, the delinquency rates in this report generally are higher than those determined by the share of accounts that are delinquent or the share of outstanding balances that are delinquent.
In the first quarter, 11.1 percent of District consumers were delinquent on at least one credit account, similar to the national rate of 11.2 percent (Chart 3). Although average debts are moderate by historical standards, delinquencies in the District and the nation have trended up from their post-recession lows. Delinquency on any account rose from 10.5 percent in the first quarter of 2016 to 11.1 percent in the first quarter of 2019 (Chart 4). Auto loans, bank cards and student loans together account for the large majority of consumer debt. Although delinquency rates on student loans have declined modestly, falling from 17.1 percent to 16.8 percent over the last three years, delinquencies on bank cards and auto loans have been increasing steadily in recent years.
Chart 3: Consumer Credit Delinquency Rates and Bankruptcy Filings

Notes: At least 90 days past due. *"Any Account" is the share of consumers who have at least one past due credit account and includes accounts not otherwise reported in the chart. Unlike other delinquency rates, which are calculated only for those with active accounts, delinquency on any account is calculated across all consumers (with credit reports). For all other categories, the delinquency rate is the share of consumers with at least one account in that category who have at least one account 90 or more days past due in that category. †Student loan delinquency includes loans in deferment and forbearance. If student loans in deferment or forbearance are not considered, the delinquency rate is considerably higher, nearly 50 percent in some states (see Wenhua Di and Kelly D. Edmiston, 2015, “State Variation of Student Loan Debt and Performance,” Suffolk Law Review, vol. 48, no. 3, pp. 661-688). Student loan data reported here were calculated using a different CCP/Equifax sample than other data in this report. ‡Mortgage delinquency is the current rate and not a moving average and includes both first and secondary liens.
Sources: Federal Reserve Bank of New York Consumer Credit Panel / Equifax; the Administrative Office of the U.S. Courts, Table F-2; Lender Processing Services, Inc. (McDash Analytics); staff calculations.
Chart 4: District Delinquency Rates by Debt Type
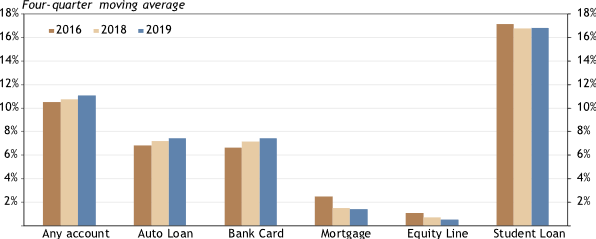
Notes: At least 90 days past due. "Any Account" is the share of all consumers (with credit reports) who have at least one past due credit account and includes accounts not otherwise reported in the chart. For all other categories, the delinquency rate is the share of consumers with at least one account in that category who have at least one account 90 or more days past due in that category. For mortgages, the delinquency rate is the share of outstanding loans 90 or more days past due or in foreclosure and includes junior liens. The mortgage delinquency rate is the current rate, not a moving average.
Sources: Federal Reserve Bank of New York Consumer Credit Panel / Equifax; Lender Processing Services, Inc. (McDash Analytics); staff calculations.
The bank card delinquency rate in the District was 7.4 percent in the first quarter, its highest level in five years.9 One year ago, the bank card delinquency rate was 7.1 percent, and in the first quarter of 2016, it was 6.6 percent. Nationally, the bank card delinquency rate increased from 7.9 percent to 8.2 percent over the past year, and the longer-term trend is similar to the District.
The increase in bank card delinquencies seems to have been driven in part by an increased presence of younger borrowers in the credit card market, who, as a group, have higher delinquency rates.11 The CARD Act (2009) limited credit card marketing and issuance to college students, which drove participation in the credit card market by younger borrowers to just 41 percent in 2012. Since then, as lending standards have been relaxed, participation has increased to 52 percent. Since 2016, the delinquency rate for young borrowers, based on share of balance 90 or more days past due, has increased from 6.9 percent to 8.1 percent.12 The comparable delinquency rate was 6.1 percent for those ages 30-39 and 5.2 percent for those ages 40-49 in the first quarter.
The District’s delinquency rate on auto loans was 7.4 percent in the first quarter, up from 7.2 percent a year ago and 6.8 percent in the first quarter of 2016. Nationally, the auto loan delinquency rate increased from 7.3 percent to 7.6 percent over the past year. Auto loan delinquency rates in both the District and the nation were at their highest levels since late 2012. As with credit cards, younger borrowers are much more likely to be delinquent on auto loans, but unlike credit cards, auto loan originations to this group have grown much more slowly than for other age groups. In recent years, rising auto loan delinquencies largely have been driven by increased delinquencies on loans made to subprime borrowers.12 The subprime share of total outstanding loans balance was at a record low in the first quarter at just under 23 percent.13
Although delinquencies on consumer debt have been increasing in recent years, delinquencies on mortgages have continued to fall. In the first quarter, 1.4 percent of District mortgages (first mortgages and non-revolving junior liens) were 90 or more days past due or in foreclosure (seriously delinquent), down 0.1 percentage point from the first quarter of 2018. The serious delinquency rate was down from 2.5 percent in the first quarter of 2016. The national rate of seriously delinquent mortgages is following a similar trend, but the rate remains well above the District rate at 2.0 percent. But the national seriously delinquent mortgage rate was down sharply from 2.5 percent one year earlier. Seriously delinquent mortgage rates varied significantly across District states, from 0.7 percent in Colorado to 2.3 percent in New Mexico (Chart 5). Seriously delinquent mortgage rates declined in all District states but Nebraska over the past year. The December 2018 issue of the Tenth District Credit Report discussed mortgage delinquency in Nebraska in detail. The delinquency rate on HELOCs fell from 0.7 percent to 0.5 percent over the past year and was down from 1.1 percent in the first quarter of 2016.
Chart 5: Seriously Delinquent Mortgage Rates
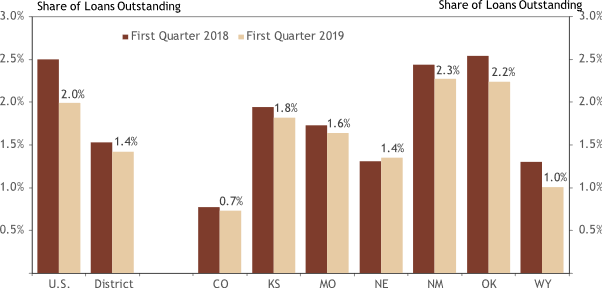
Note: Residential Mortgages, 90 or more past due or in foreclosure.
Sources: Lender Processing Services, Inc. (McDash Analytics); staff calculations.
Other than HELOCs, the only consumer debt category where delinquency rates did not rise in the first quarter from one year ago was student loans. The student loan delinquency rate was flat at 16.8 percent, but down from 17.1 percent in the first quarter of 2016. Still, the student loan delinquency rate remained well above its pre-recession levels, which were consistently under 13 percent. The national student loan delinquency rate fell to 15.7 percent from 15.9 percent a year earlier and was down sharply from 16.7 percent in the first quarter of 2016.
Summary
Although aggregate consumer debt continues to rise to historic highs, increases in average consumer debt, adjusted for inflation, have been quite moderate. In the District, inflation-adjusted average consumer debt grew at an annual rate of just over 1 percent from its post-recession lows through 2017 and since then has been relatively flat. Growth in debt has been even more modest nationally. Average levels of revolving debt have continued to fall. Aggregate levels of auto debt have been increasing very sharply, but that increase largely is due to more borrowers. Average levels of auto debt have increased much more slowly, especially in the last two years. While average consumer debt loads have remained in check, delinquency rates recently have increased. Delinquency rates on consumer debt warrant close monitoring, especially for auto loans and credit cards. Conversely, mortgage delinquency rates are very low by historical standards and continue to fall.
In This Issue: The Affordability of Consumer Debt
The previous issue of the Tenth District Consumer Credit Report highlighted a record high level of aggregate nominal consumer debt, but argued that several factors should mitigate potential concerns about the level of debt, including inflation adjustment, per-consumer debt and debt-to-GDP. Another important issue is the ability of an individual or family to make debt service payments (principal and interest) out of disposable income. The consumer debt service ratio has climbed moderately over the last few years, but it has been offset by declines in the share of disposable income required to service mortgage debt. Total household debt service to disposable income largely has remained flat.
This issue’s special topic considers whether the capacity to pay off debt differs across geographic regions; specifically, states and counties in the Tenth District. Access to data on consumer debt comes from the Federal Reserve Bank of New York Consumer Credit Panel/Equifax, which consists of a 5 percent sample of all Equifax credit reports (the data are cleaned of any identifying information). While I have significant information on individual debts, and in many cases required payments on those debts, credit reports do not include information on income. Without income tied to the credit report, I am unable to gauge an individual’s capacity to pay his/her debts.
Instead, I use average debt relative to median household income to make geographic comparisons.14 That is, I use average consumer debt as a share of household median income as a gauge of the debt burden facing households in each state in terms of capacity to repay consumer debt with income.15 Consumer debt is not distributed evenly across the household income distribution. A number of factors determine the debt burden facing any one individual or household, including the median household. These aggregate measures are intended to signal differences in the capacity to pay off debt across geography and over time rather than the capacity to pay off debt for a typical household.
In the first quarter, average consumer debt in the District ($17,698) was 30.9 percent of household median income ($57,229) (Chart 6). This ratio was similar to that of the nation, which was 32.1 percent ($18,497/$57,652). Household median income is roughly the same in the District and nation, so the moderately higher ratio of debt to income nationally is due almost entirely to a greater level of average consumer debt. Thus, national average consumer debt is not only higher than District average consumer debt in absolute terms, but also comparatively higher in relation to income.
Chart 6: Average Consumer Debt as a Share of Household Median Income
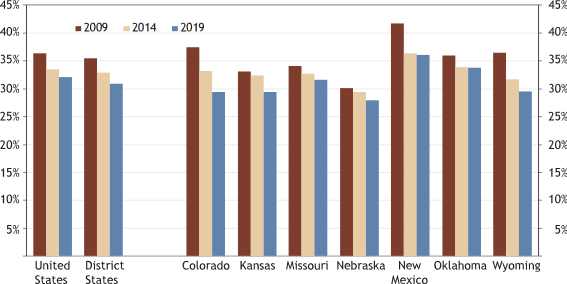
Notes: These ratios are a gauge of the debt burden facing households in each state in terms of capacity to repay consumer debt with income. Consumer debt is not distributed evenly across the household income distribution. A number of factors determine the debt burden facing any one household, including the median household. Income is not captured on credit reports. These aggregate measures are intended to signal differences in the capacity to pay off debt across geography and over time rather than the capacity to pay off debt for a typical household. These figures should not be confused with debt service burdens or ratios, which are intended to measure households' ability to meet debt obligations. Typically, these burdens are measured as the ratio of required monthly debt installments (which usually include principal and interest) relative to monthly disposable income.
Sources: Federal Reserve Bank of New York Consumer Credit Panel /Equifax; U.S. Census Bureau, American Community Survey; staff calculations.
Differences in average consumer debt relative to household median income are much more pronounced when comparing District states. Average consumer debt in Nebraska in the first quarter ($16,767) was 28 percent of median household income in the state ($59,970), while average consumer debt in New Mexico ($16,834) was 36 percent of household median income in that state ($46,744). In this case, consumer debt is comparatively much larger in New Mexico, but not because of the difference in average consumer debt, which is negligible, but rather because household median income is substantially lower in New Mexico than in Nebraska. The higher ratio in New Mexico relative to Nebraska indicates that a household with median income in Nebraska would have a greater capacity to pay the average level of consumer debt than would a comparable household in New Mexico. A simple comparison of average consumer debt in Nebraska and New Mexico suggests that their consumer debt burdens are in some sense equal, at least on average. But the ratios of average debt to median household income show that average consumer debt in New Mexico actually is comparatively much higher than in Nebraska.
Past issues of the Tenth District Consumer Credit report consistently have shown Colorado to have higher average consumer debt than other District states, much higher in comparison with some District states. But comparisons of average consumer debt to median household income put debt in Colorado relative to other District states in a much different perspective. Median household income in Colorado ($69,117) is 20.8 percent higher than District median household income and 47.9 percent higher than median household income in New Mexico. Average consumer debt relative to median household income shows the consumer debt load in Colorado to be much more comparable to other District states. Indeed, using this ratio, the average consumer debt load in Colorado is the same as the average consumer debt load in Kansas. The debt-to-income ratio is 29.4 percent in both states, and in Wyoming, it is 29.5 percent.
Normalizing average consumer debt by median household income also puts the time series of consumer debt loads in better perspective. Average consumer debt in the District declined 14.2 percent between 2009 and 2014, from $20,154 to $17,144. But median household income also declined over that period from $56,795 to $52,080. Thus, the decline in the burden of consumer debt was much less substantial at 7.2 percent.
As the level of geography gets smaller, the range in debt to income gets much wider. Map 1 shows average consumer debt relative to median household income for District counties. The variation in debt load, normalized by median household income, is considerable. Some counties have debt-to-income ratios below 20 percent, while others have ratios of more than 60 percent. The median ratio is 32.3 percent, while the 10th percentile is 20.8 percent, and the 90th percentile is 47.2 percent. The variation across counties indicates that the carrying capacity of the average debt load is markedly different across the District.
Map 1: Average Consumer Debt as a Share of Household Median Income in Tenth District Counties
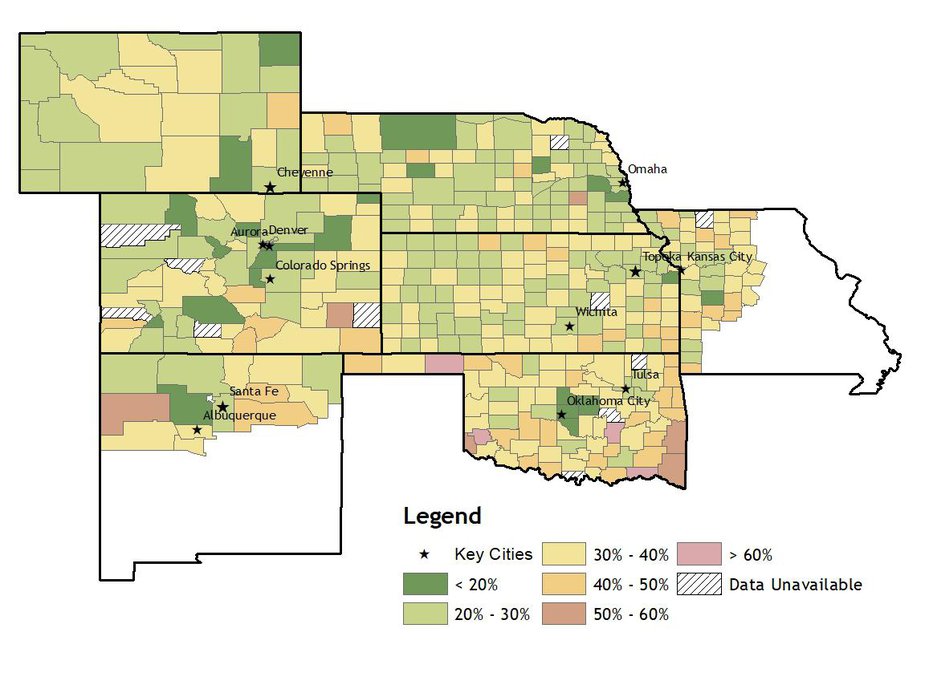
Notes: These ratios are a gauge of the debt burden facing households in each county in terms of capacity to repay consumer debt with income. Consumer debt is not distributed evenly across the household income distribution. A number of factors determine the debt burden facing any one household, including the median household. Income is not captured on credit reports. These aggregate measures are intended to signal differences in the capacity to pay off debt across geography and over time rather than the capacity to pay off debt for a typical household. These figures should not be confused with debt service burdens or ratios, which are intended to measure households' ability to meet debt obligations. Typically, these burdens are measured as the ratio of required monthly debt installments (which usually include principal and interest) relative to monthly disposable income.
Sources: Federal Reserve Bank of New York Consumer Credit Panel /Equifax; U.S. Census Bureau, American Community Survey; staff calculations.
In addition to revealing the wide differences in consumer debt loads, county-level data provide an added benefit of making comparisons across groups. A comparison of average debt loads by income is striking. Low- and moderate-income (LMI) counties—those with incomes less than 80 percent of the state median—carry much heavier consumer debt loads relative to income than do those in middle-income and high-income counties (Table 1). Specifically, average consumer debt relative to median household income is 43.3 percent at its median in LMI counties, and the 10th-90th percentile range is 30.3 to 58.8. By contrast, the median ratio for middle- and high-income counties is 30.6 percent and the 10th-90th percentile range is 19.9 to 42.5. Those in LMI counties are much more likely to struggle with their consumer debt burdens than those in middle- and high-income counties. Also revealing is that average consumer debt relative to median household income is remarkably similar between urban and rural counties. The median ratio is 31.8 percent in urban counties and 32.7 percent in rural counties.
Table 1: Average Consumer Debt to Median Household Income Across U.S. Counties

Summary
A comparison of average consumer debt across either geography or time gives an incomplete picture of relative debt burdens. An analysis of ratios of average consumer debt to median household income reveals significant variation in debt burdens across time and space. While average debt levels may have declined over the past several years, my analysis shows that some areas may be more constrained to take on additional or payoff existing debt.
Endnotes
-
1 [*] The author acknowledges helpful assistance from Sabrina Minhas, an assistant economist at the Federal Reserve Bank of Kansas City.
[1] See Fair Isaac Corp., “External LinkUnderstanding FICO Scores: What You Need to Know about the Most Widely Used Credit Scores,” and Federal Trade Commission, “External LinkCredit Scores.”
[2] See Experian, “External LinkGood Debt vs. Bad Debt: What’s the Difference?” April 21, 2019.
[3] Bureau of Economic Analysis, Personal Consumption Expenditures, Motor Vehicles and Parts (chained 2012 dollars). Extracted from the Haver Analytics database.
[4] Andrew Haughwout, Donghoon Lee, Joelle Scally and Wilbert van der Klaauw, May 14, 2019, “External LinkJust Released: Shifts in Credit Market Participation over Two Decades,” Liberty Street Economics blog, Federal Reserve Bank of New York.
[5] Experian, “External LinkState of the Automotive Finance Market,” Q1 2019 (presentation by Melinda Zabritski).
[6] SHED data and a summary report of findings from the survey are available on the Federal Reserve Board’s website at External Linkhttps://www.federalreserve.gov/consumerscommunities/shed.htm.
[7] Supra, note 4.
[8] Author calculations using SHED microdata.
[9] Banks often exclude charged-off loans when reporting delinquency rates, including credit cards. In credit reports, these charge-offs often are still reflected in the “severe derogatory” category, which is included in the calculation of delinquency rates. Thus, delinquency rates reported by banks almost always will be lower than delinquency rates derived from credit reports.
[10] Supra, note 4. Much of the discussion in this paragraph is based on this source.
[11] Delinquency rates based on share of outstanding balance that is past due typically are lower than those based on the share of consumers who have delinquent accounts, which is the method used in this report. The difference arises primarily because delinquency is more common on trade lines with lower balances.
[12] See Jason P. Brown and Colton Tousey, “Auto Loan Delinquency Rates Are Rising, but Mostly among Subprime Borrowers,” Macro Bulletin, Federal Reserve Bank of Kansas City, Aug. 15, 2018.
[13] Supra, note 5.
[14] References throughout this section to “average consumer debt” mean “inflation-adjusted average consumer debt.”
[15] Average consumer debt is calculated on the basis of individual consumer reports. Many significant debts in families are joint debts, and counting the same debt, from, say, a husband’s and wife’s credit reports, would double-count the joint debt for the household. To this extent, we are able to roughly capture household debt from the credit report of an individual consumer in the household. On the other hand, if a husband and wife each has an individual credit card, for example, we would understate household debt. Many, if not most, households have individuals with at least some of their own debts, so, in general, our measure of average consumer debt likely understates the actual amount of debt facing the average household. We are not attempting to capture the capacity to pay off debts for individual households, so this factor is important only to the extent that there would be systematic differences in the likelihoods of individual household members to carry individual debts across states or counties.
The views expressed are those of the authors and do not necessarily reflect the positions of the Federal Reserve Bank of Kansas City or the Federal Reserve System.