Change in Net Commercial Bank Branches and Deposit Market Share
- As of June 2022, there are over 73,000 commercial bank branches across the U.S., 40 percent of those being CBO branches and 60 percent being non-CBO branches. The number of total commercial bank branches has declined every year for well over a decade. This decline was particularly pronounced during the COVID-19 pandemic when, between 2020 and 2021, the number of bank branches declined by almost 4 percent as more than 3,100 commercial bank branches were closed.
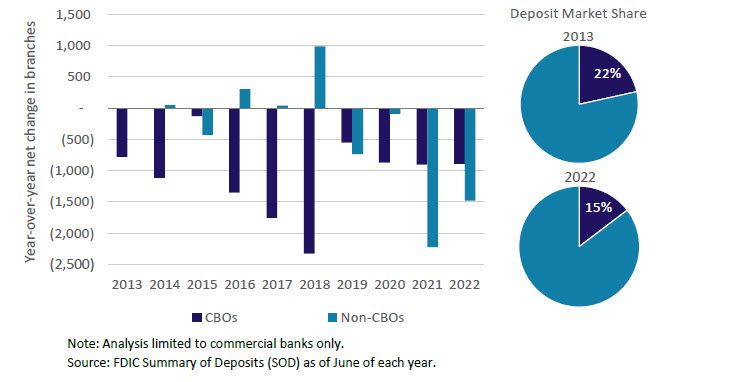
- Though overall branch numbers have been declining, the trend in branch counts vastly differ between CBOs and non-CBOs. Prior to the pandemic, CBOs saw a net decline in branches that outpaced that of non-CBOs, with net branches at non-CBOs actually increasing from 2016-2018. However, non-CBOs experienced a more significant net decline in branches in 2021 and 2022 compared to that of CBOs.
- Following a similar trend as branch counts, CBO deposit market share has been declining for over a decade. While the entire U.S. banking system has experienced significant deposit growth since the onset of the pandemic, CBO deposit market share has decreased to 15 percent in 2022, down from 22 percent in 2013.
Questions or comments? Please contact KC.SRM.SRA.CommunityBankingBulletin@kc.frb.org.
Endnotes
-
1 *Community banking organizations are defined as having less than $10 billion in total assets
The views expressed are those of the authors and do not necessarily reflect the positions of the Federal Reserve Bank of Kansas City or the Federal Reserve System.