Farm debt at commercial agricultural banks continued to grow at a moderate pace in the second quarter. According to Reports of Condition and Income, growth in farm debt remained considerably stronger at banks most concentrated in agricultural lending compared with other banks. Demand for financing has increased alongside weak profit margins and reduced working capital for crop producers. Delinquency rates on agricultural loans remained low, but increased slightly alongside gradual deterioration in farm financial conditions. Earnings and capital performance at agricultural banks remained sound with support from loan growth while liquidity tightened.
Disparities in the agricultural economy persisted through September with favorable conditions for livestock producers and weak profit opportunities in the crop sector. Strength in livestock industries, particularly cattle, has supported farm finances in some regions. Recent ad hoc government payments associated with the American Relief Act and resilient farm real estate values have also eased some stress in the sector. Looking ahead, however, low crops prices and elevated production expenses will likely continue weighing on farm finances and credit conditions in the coming months.
Second Quarter 2025 Commercial Bank Call Report Data
Similar to the past year, farm debt grew steadily at agricultural banks but was generally flat among all other commercial lenders. Farm real estate debt was 5 percent higher than a year ago at agricultural banks and decreased slightly at non-agricultural banks (Chart 1). Growth in production debt also remained strong at those banks concentrated in farm lending, increasing nearly 10 percent from a year ago.
Chart 1: Change in Farm Debt Outstanding at Commercial Banks
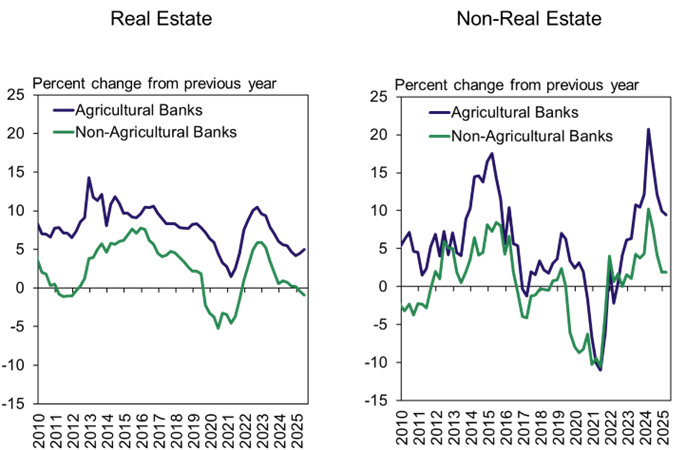
Note: Agricultural Banks are defined as banks with total agricultural loans comprising at least 25 percent of total loans. Figures above are calculated using the same group of 931 agricultural banks from Q2 2025 in every quarter.
Sources: Reports of Condition and Income and Federal Reserve Board of Governors
Strong growth has pushed aggregate farm debt balances at agricultural banks to record highs. Outstanding real estate and non-real estate debt at the cohort of agricultural lenders from the second quarter climbed further and remained well above recent historic averages adjusted for inflation (Chart 2). For non-agricultural banks, production debt remained subdued and outstanding balances of real estate debt were slightly below the 20-year average.
Chart 2: Level of Farm Debt Outstanding at Commercial Banks
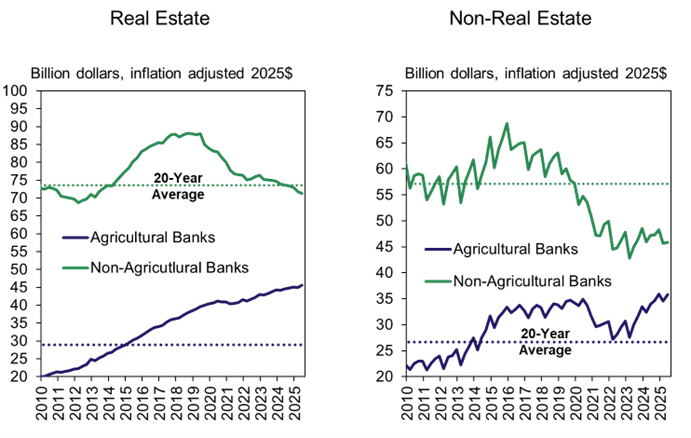
Note: Agricultural Banks are defined as banks with total agricultural loans comprising at least 25 percent of total loans. Figures above are calculated using the same group of 931 agricultural banks from Q2 2025 in every quarter.
Sources: Reports of Condition and Income and Federal Reserve Board of Governors
Growth has remained strong for a large share of agricultural banks. During the second quarter, total farm loan balances increased more than 5 percent at half of all agricultural banks and more than 10 percent at a quarter of those banks (Chart 3, blue and purple lines). Farm debt grew by less than 5 percent for a quarter of agricultural banks and decreased for the remaining quarter.
Chart 3: Distribution of Farm Debt Growth at Agricultural Banks
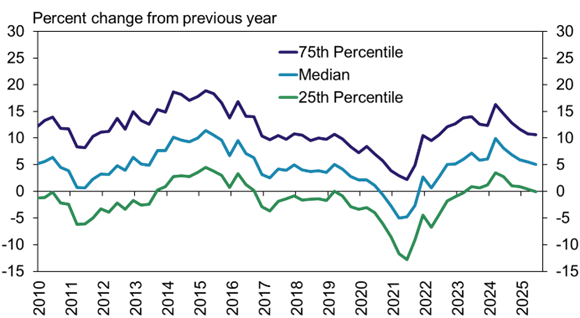
Note: Agricultural Banks are defined as banks with total agricultural loans comprising at least 25 percent of total loans.
Source: Reports of Condition and Income and Federal Reserve Board of Governors
Earning performance for agricultural banks has strengthened alongside strong loan growth and liquidity has tightened. The net interest margin increased to the highest level since early 2020 with support from higher interest income and return on assets improved notably from a year ago (Chart 4, left panel). While strong loan growth supported returns, increased lending also led to a slightly higher loan-to-deposit ratio at agricultural banks (Chart 4, right panel).
Chart 4: Earnings and Capital at Agricultural Banks
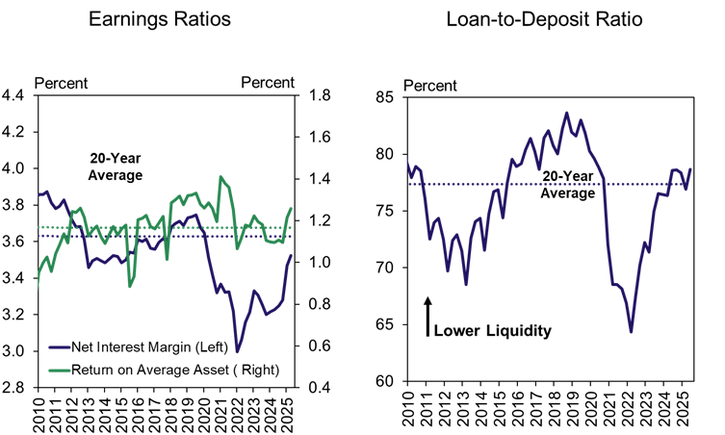
Note: Agricultural Banks are defined as banks with total agricultural loans comprising at least 25 percent of total loans.
Source: Reports of Condition and Income and Federal Reserve Board of Governors
Farm loan delinquency rates increased slightly alongside weaker farm finances but remained low. About 1.3 percent of farm loans at both agricultural and non-agricultural banks were delinquent in the second quarter (Chart 5, left panel). More than a third of agricultural banks had no past due or nonaccrual farm loans and only a quarter of agricultural banks had delinquency rates above 1.5 percent (Chart 5, right panel, green and purple lines).
Chart 5: Farm Loan Delinquency Rates at Commercial Banks, Q2
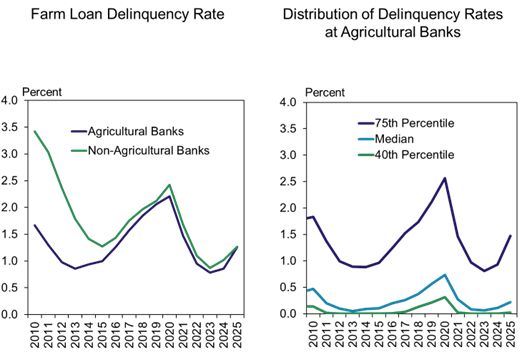
Note: Delinquent farm loans include all agricultural loans past due 30 or more days or non-accruing. Agricultural banks include all banks with farm loans comprising at least 25 percent of total loans.
Sources: Reports of Condition and Income and Federal Reserve Board of Governors
Commercial Bank Call Report Historical Data
Commercial Bank Call Report Data Tables
External LinkAbout Commercial Bank Call Report Data
The views expressed are those of the authors and do not necessarily reflect the positions of the Federal Reserve Bank of Kansas City or the Federal Reserve System.
Author
