The U.S. agricultural economy has continued to weaken in the first quarter of 2016 and is expected to remain soft through the year. The weakening has been relatively gradual over the past few years, but it has been persistent and has intensified in recent months amid mounting financial stress for some agricultural producers. Future cash flow appears likely to remain a top concern for producers over the coming year as agricultural credit conditions, and the path of interest rates, evolve.
Farm Income
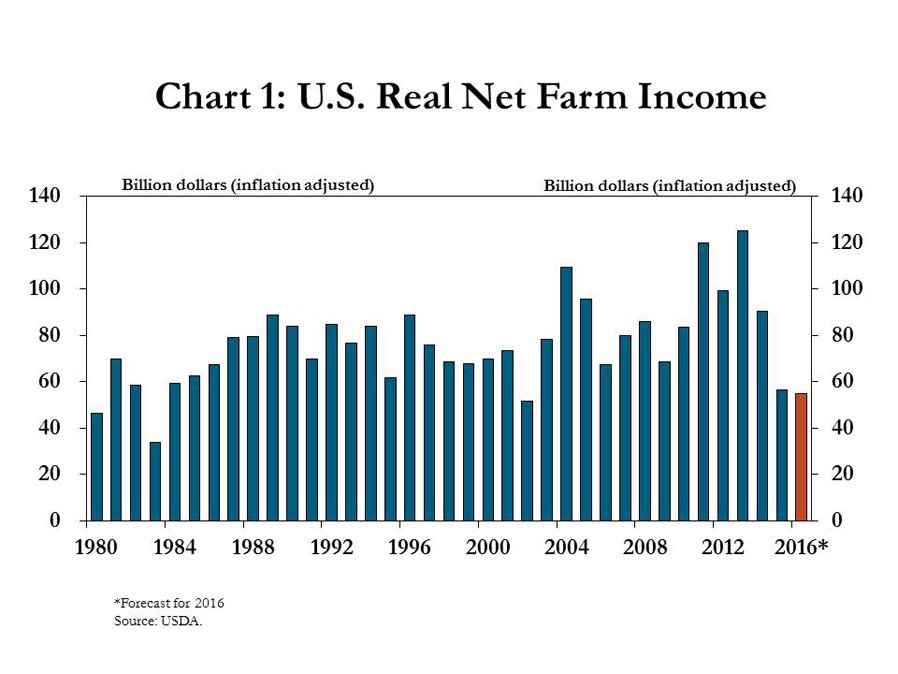
U.S. farm income has continued to decline, and is expected to remain low as planting season approaches across the country. The USDA projects real net farm income to be slightly less than a year ago; that projection would mark the second-lowest farm income total in more than 30 years (Chart 1). Prolonged weakness in the farm sector primarily has been driven by several consecutive years of low crop prices and persistently elevated input costs, while recent weakness in the livestock sector also has been a factor.
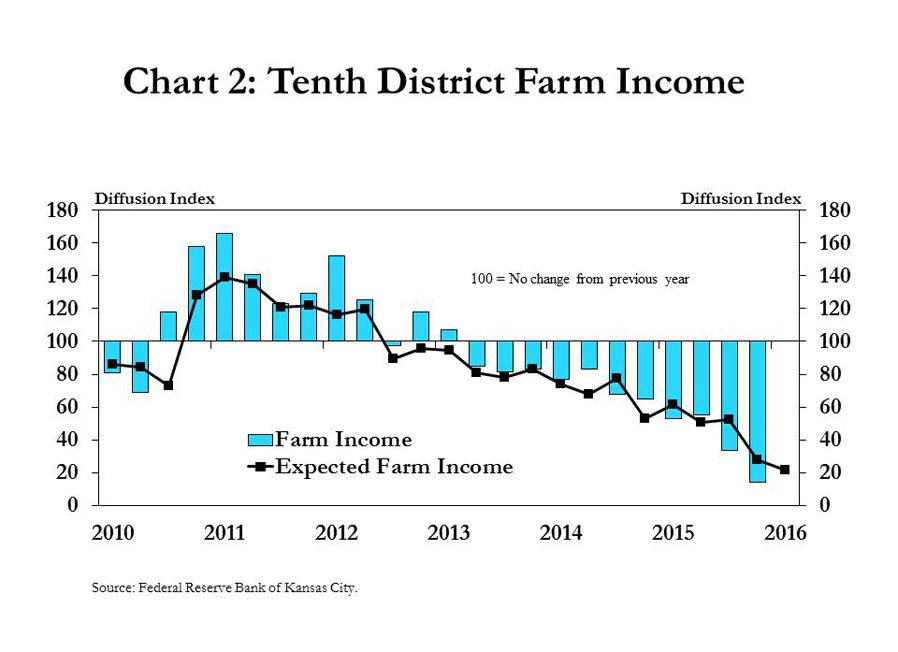
Data from the Federal Reserve Bank of Kansas City’s Survey of Agricultural Credit Conditions paint a similar picture for the Tenth District. The survey indicates farm income in the Kansas City Fed District began to decrease in mid-2013 (Chart 2). Since then, more bankers have reported further declines, and the fourth quarter of 2015 was the 11th consecutive quarter of lower farm income in the District. Among 190 survey respondents, only three bankers indicated farm income was higher than a year ago, whereas 166 reported income had declined. Moreover, 81 percent of respondents indicated they expect income to be even lower in the next quarter.
Agricultural Credit
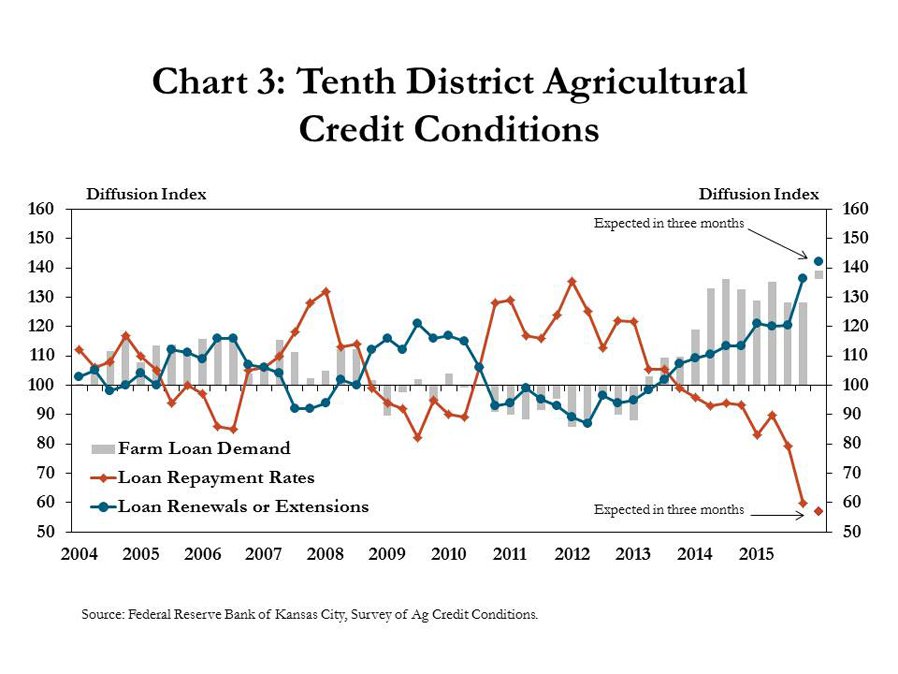
The need for financing, and the potential for future financial stress, has continued to increase throughout U.S. farm country. Loan demand in the Tenth District is expected to increase again in the first quarter of 2016, which would be the third consecutive year in which lending needs in the farm sector increased relative to the previous year (Chart 3). Similarly, bankers responding to the fourth quarter survey indicated they expect loan renewals and extensions to continue to accelerate. Conversely, the rate at which loans are repaid at agricultural banks in the District was expected to soften further.
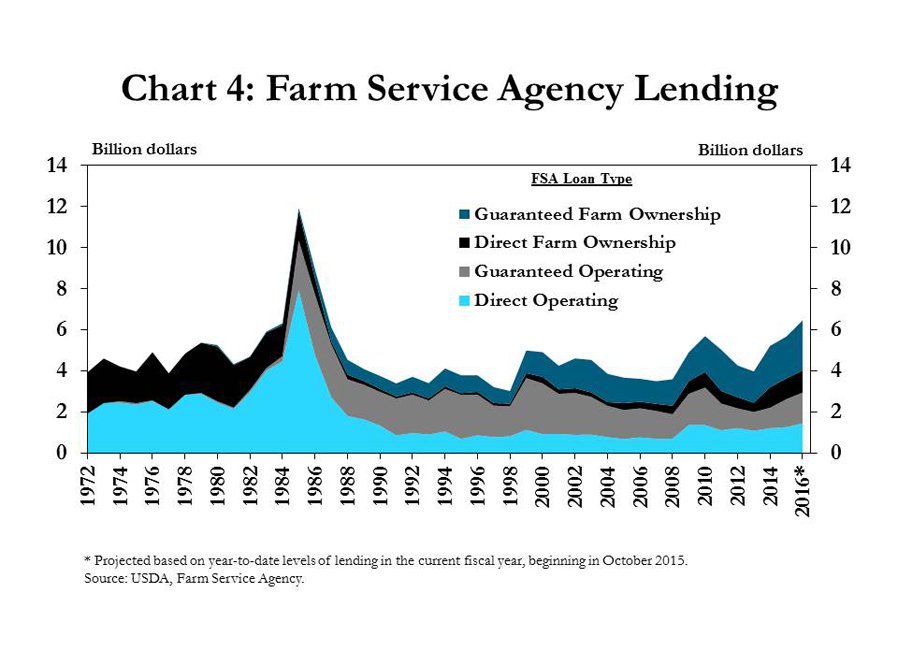
Persistently strong loan demand at agricultural banks has been coupled with reports of increasing use of USDA Farm Loan Programs through the Farm Service Agency (FSA). From 2013 to 2015, FSA loan volumes increased more than 40 percent (Chart 4). Consistent with bankers’ recent anecdotal reports of increased use, about 55 percent of FSA funds available for operating loans had already been used from October 2015, the beginning of the FSA fiscal year, to mid-March. Bankers noted the increased use is due, in part, to an effort to mitigate risk connected to an increasingly pessimistic outlook for future cash flows.
Interest Rates
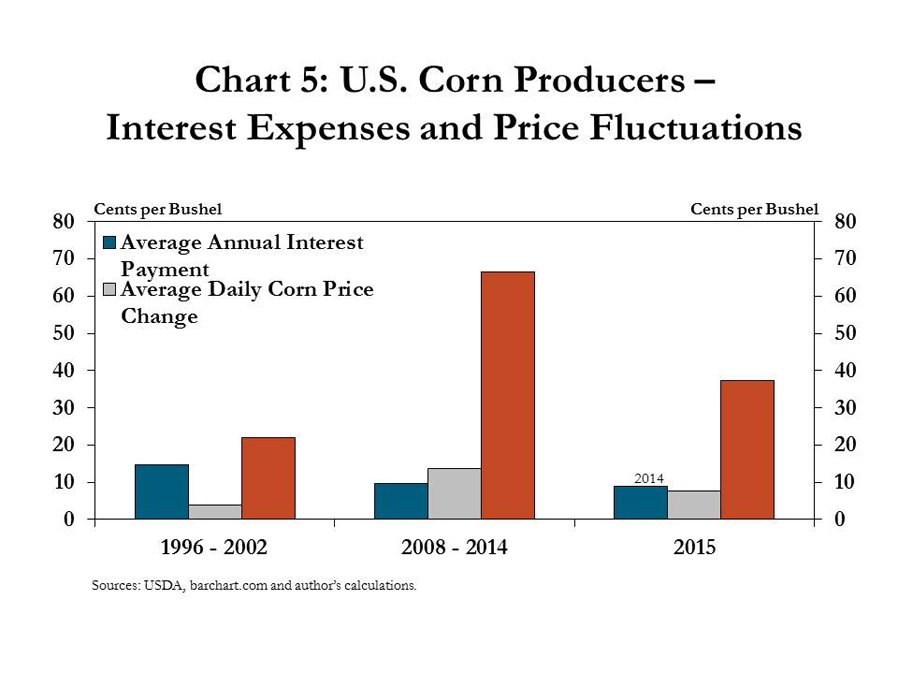
Pessimism about cash flows and profit margins appears to be the main factor driving the weak outlook in the agricultural economy, whereas interest expenses have remained low. Despite strong loan demand and an increase in the federal funds target rate in December, interest rates on most farm loans have remained historically low. In fact, interest expenses for U.S. corn producers accounted for only 9 cents per bushel of production in 2014, the latest year for which data are currently available (Chart 5). In contrast, the average monthly change in corn prices was nearly 40 cents per bushel in 2015. Indeed, the average daily change in corn prices of 8 cents per bushel in 2015 is roughly equal to total annual interest expenses on a per bushel basis, suggesting that commodity prices and production expenses are likely to outweigh potential near-term concerns about higher interest rates.
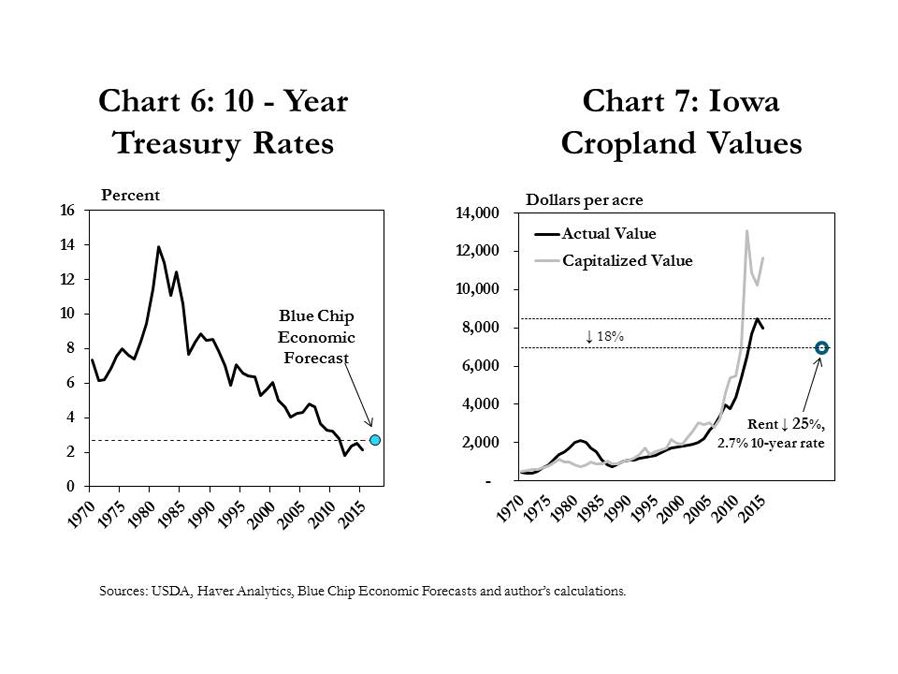
Higher interest rates generally exert downward pressure on farmland values, but other factors also may be important in the current outlook for farm real estate. Specifically, private sector forecasts of long-term interest rates suggest cash rents may need to fall significantly to have a sizable impact on farmland values in the Corn Belt. In March, the Blue Chip Economic Forecast for the U.S. 10-year Treasury rate was 2.7 percent for 2017 (Chart 6). The capitalized value of farmland, calculated by dividing cash rents by the 10-year Treasury rate, has tracked rather closely with the actual value of farm real estate over time (Chart 7). Applying the Blue Chip Treasury rate assumption for 2017, Chart 7 shows that a 25 percent drop in cash rents (equivalent to the largest two-year decline in Iowa during the 1980s) would lead to a decrease of 18 percent from the recent peak.
A drop in farmland values of this magnitude in the Corn Belt would be notable, but it would be unlikely to trigger widespread concerns about solvency in the sector overall. An 18 percent drop in farmland values nationally, for example, would push the U.S. farm sector debt-to-asset ratio to 16.1 from USDA’s current projection for 2016 of 13.2, holding debt levels constant at levels forecast for this year. This would also be a noteworthy rise in the debt-to-asset ratio but still well below levels observed during the farm bust of the 1980s.