Agricultural real estate values in the Kansas City Federal Reserve District declined slightly in the first quarter of 2025 and credit conditions deteriorated further. According to lenders in the region, the average value of nonirrigated farmland declined about 2% from a year ago. Land market conditions varied in some states, but in aggregate, values declined slightly following a moderation in farm incomes over the past year. Alongside subdued economic conditions, farm loan repayment rates declined, demand for financing grew and instances of carryover debt and loan restructuring increased notably from a year ago. Deterioration in farm finances was most pronounced in areas more dependent on crop revenues while strong cattle prices continued to support conditions in some parts of the region.
The agricultural economy remained subdued through early 2025 alongside weak crop prices. The results of the Survey of Agricultural Credit Conditions were captured in late March, ahead of recent distribution of assistance payments from the Emergency Commodity Assistance Program (ECAP) which could potentially improve liquidity for some producers. Looking ahead, however, relatively low crop prices are likely to continue weighing on financial conditions in the sector and further pressure credit conditions. Farm loan interest rates also remained above recent historic averages, which could pressure land markets and make financing costs particularly challenging for more highly leveraged borrowers.
Farm Real Estate Values and Interest Rates
Farm real estate values in the Tenth District declined slightly in early 2025. According to survey respondents, the value of nonirrigated farmland in the Tenth District was about 2% less than a year ago in the first quarter and irrigated land values declined about 4% (Chart 1). The value of ranchland was about 1% higher and cash rents on all types of land were unchanged.
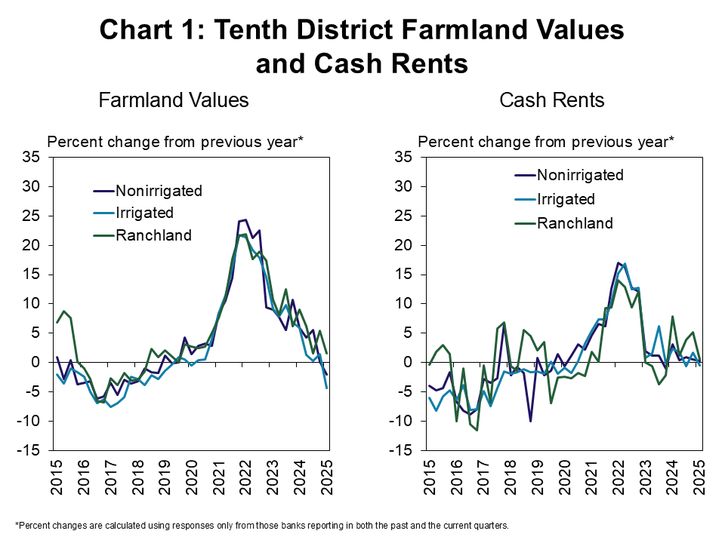
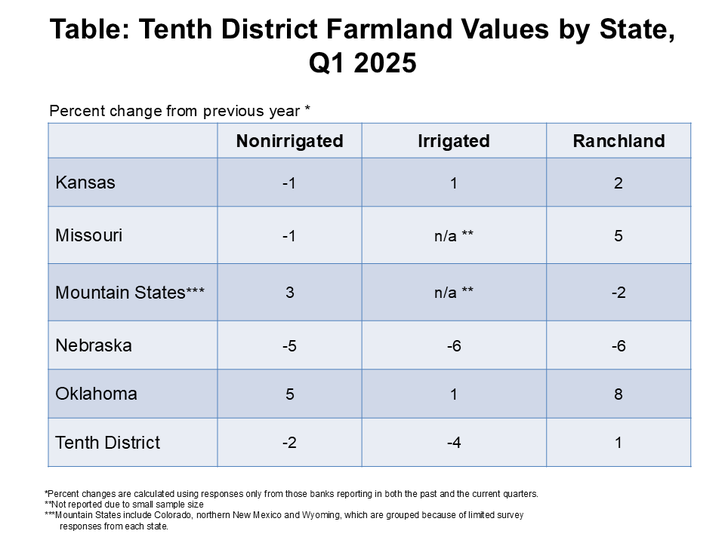
Similar to the previous quarter, changes in values varied across states and types of land. The value of nonirrigated land declined slightly in Kansas, Missouri and Nebraska but increased modestly in Oklahoma and the Mountain States (Table). All land types were at least 5% less in Nebraska while values in Oklahoma increased for all types.
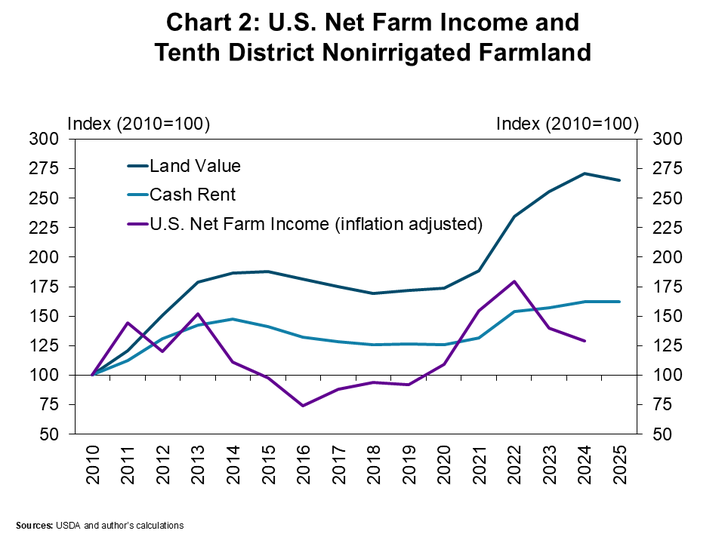
Farmland markets softened alongside further moderation in the farm economy over the past year, but valuations remained strong. The value of nonirrigated farmland eased modestly from record highs following two consecutive years of declines in U.S. net farm income (Chart 2, blue and purple lines). Despite some easing, average farmland values remained more than 50% higher than in 2020 and 165% higher than in 2010. Over those same time periods, cash rents increased only 30% and 60% from 2020 and 2010, respectively.
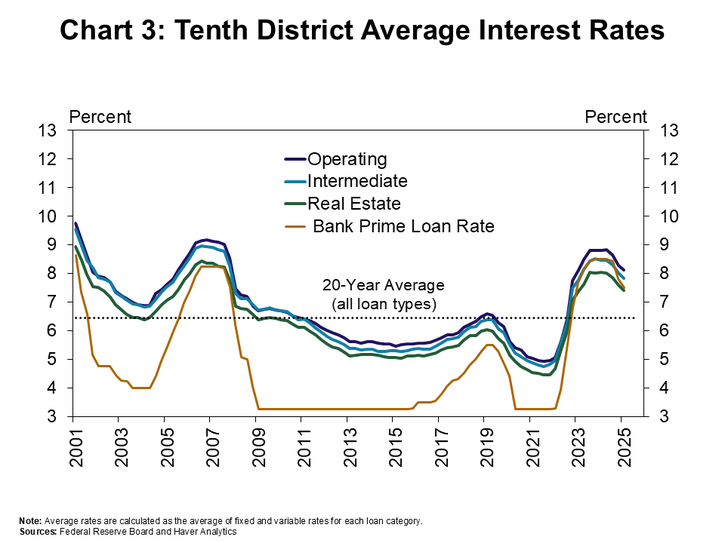
Together with a weaker farm economy, elevated farm loan interest rates also contributed to cooler agricultural real estate markets. Interest rates on farm loans have dropped slightly over the past year alongside lower benchmark rates, but remained about 100 basis points above the average of the past 20 years (Chart 3). The average rate charged on all types of agricultural loans was about 20 basis points less than the previous quarter and about 60 basis points less than the same time a year ago.
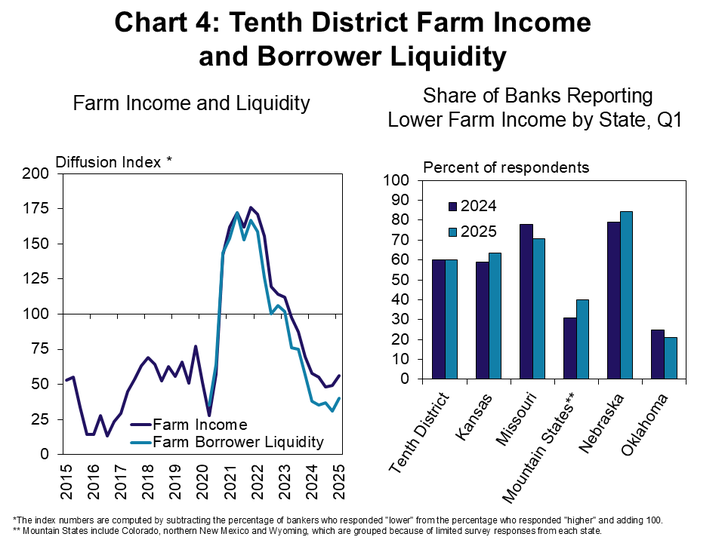
Farm Income and Credit Conditions
Farm financial conditions in the Tenth District continued to weaken gradually through the first quarter of 2025. According to survey respondents, the pace of decline in farm income and borrower liquidity remained similar to recent quarters (Chart 4). Around 60% of lenders reported that farm income was less than a year ago and the share was comparatively smaller in Oklahoma and the Mountain States, which rely more heavily on cattle revenues.
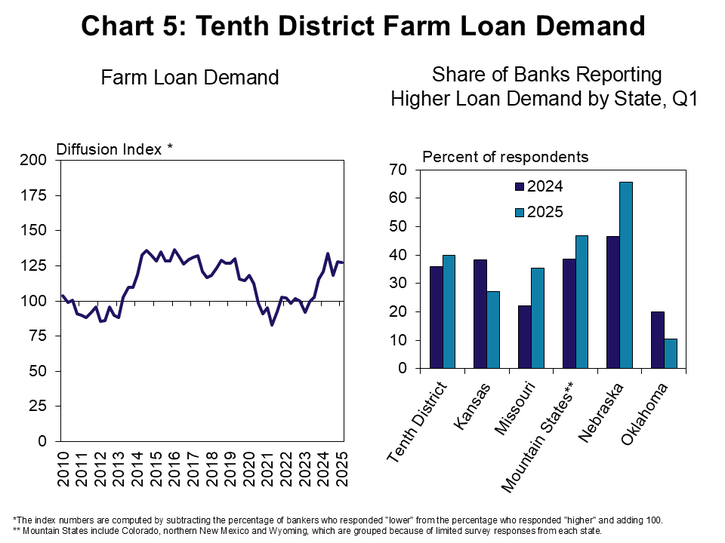
With gradual depletion of farm borrower liquidity, non-real estate farm loan demand continued to grow steadily. The pace of increase in loan demand was also similar to recent quarters (Chart 5). The share of lenders reporting that loan demand was higher than the previous year was comparable to last year in most states, but increased notably in Nebraska.
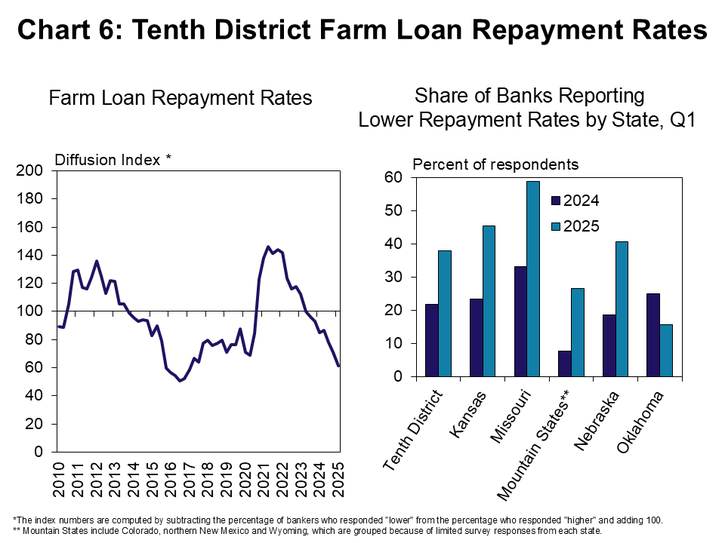
Farm loan repayment also weakened further alongside subdued farm incomes. The pace of decline in farm loan repayment rates was faster than previous quarters as the share of banks reporting lower rates of repayment increased throughout the region (Chart 6). In nearly all states, the share reporting that loan repayment rates were lower than a year ago was twice as high as this time last year. Similar to farm income, loan repayment rates deteriorated comparatively less in states with higher reliance on cattle production.
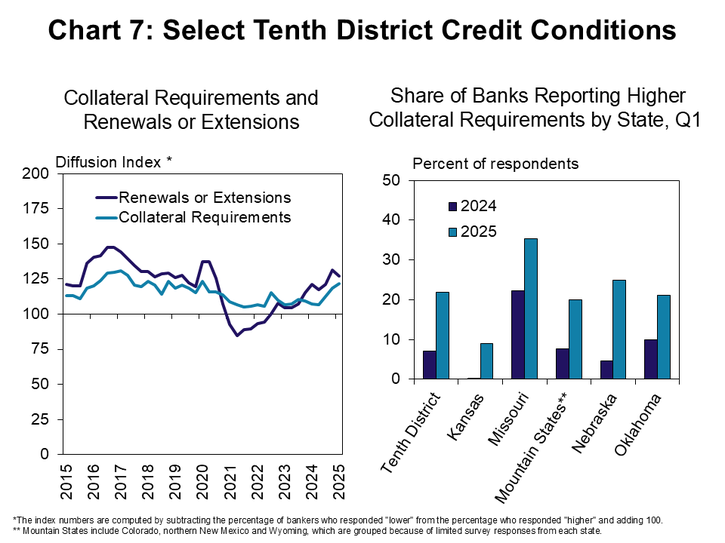
As repayment rates slowed, loan extensions increased, and some lenders tightened credit standards. The pace of increase in renewal and extension activity was similar to the previous quarter, continuing to rise steadily (Chart 7). Similar to loan repayment rates, the share of lenders reporting increased collateral requirements doubled throughout the District.
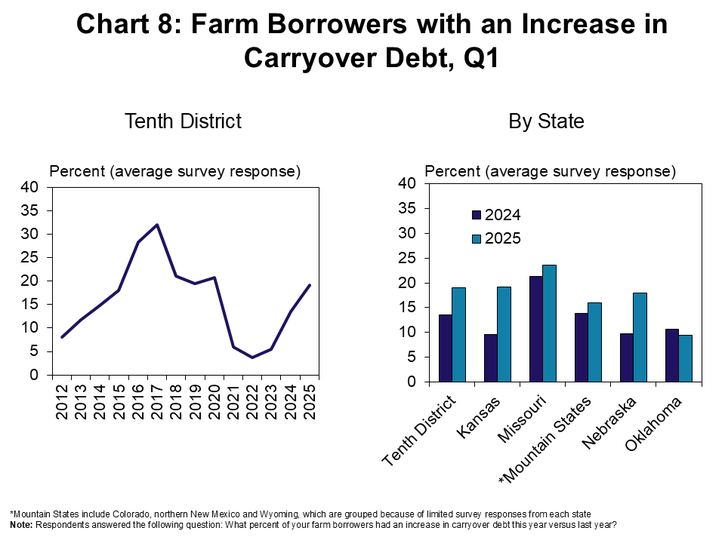
Instances of carryover debt rose modestly as many lenders entered loan renewal season. On average, about 20% of farm borrowers in the District had an increase in debt not covered by operating revenues from the past year (Chart 8). The rate of carryover was about 8 percentage points higher than the previous year and was similar across most states.
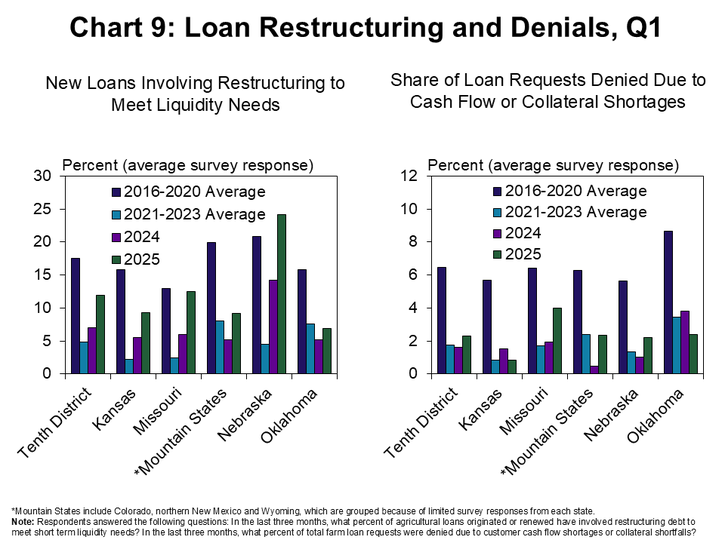
Cases of restructuring also increased alongside carryover debt, but loan denials remained limited for most lenders. The average share of farm loans in the region requiring restructuring to support liquidity needs increased to more than 10% from about 5% a year ago (Charts 9). Despite signs of tighter financial conditions, the average share of loans denied due to cash flow shortages or collateral shortfalls remained near 2% in all states except Missouri.
Most producers remained highly solvent, but a sizeable share of farm borrowers were also highly leveraged. According to respondents, about three quarters of all farm borrowers, on average, had debt-to-asset ratios below 0.40 and a quarter had ratios below 0.20 (Chart 10). Another quarter of borrowers, however, had ratios above 0.40 and are more exposed to financial stress and challenges with loan repayment.

Banker Comments Q1 2025
“Livestock primary income producers have strong liquidity with 2025 projections reflecting positive margins. Livestock forage primary income producers have low liquidity with 2025 projections reflecting negative to breakeven margins.” – Wyoming
“The high price of cattle is the only thing saving wheat farmers in our area and it is looking like another year of drought for summer crops. Those without cattle are facing more significant challenges.” – Kansas
“Low grain prices have put a strain on our borrows cashflow last year and borrowers made payments but they don't have the cash line in the past couple of years to start the year.” – Kansas
“Broad inflation, high input cost, tariffs and dry moisture conditions will impact agriculture in 2025.” – Missouri
“Operating paybacks are definitely slower and the decrease in prices hurt farmers considerably. However, some farmers had a decent year and it seems like there’s not a lot of in between” – Missouri
“The current grain prices coupled with high input costs that are stubbornly not adjusting has made for one of the toughest renewal seasons we can remember in terms of trying to build cash flow projections.” – Nebraska
“Borrowers lost a lot of liquidity in 2024 and we had some restructuring for working capital shortfalls. Cash flow projections are very tight if positive going into 2025.” – Nebraska
“Liquidity will be affected by the economic aid payment, however, a major portion of customers will use the payment to reduce debt or carryover debt and it will not be used for current cash flow needs.” – Oklahoma
“The cattle market has helped out this year.” – Oklahoma
A total of 117 lenders responded to the First Quarter Survey of Agricultural Credit Conditions in the Tenth Federal Reserve District—an area that includes Colorado, Kansas, Nebraska, Oklahoma, Wyoming, the northern half of New Mexico and the western third of Missouri. Please refer questions to Nathan Kauffman or Ty Kreitman at 1-800-333-1040.
The views expressed are those of the authors and do not necessarily reflect the positions of the Federal Reserve Bank of Kansas City or the Federal Reserve System.
Author
