Although consumer demand has rebounded strongly after the initial COVID-19 pandemic shock, employment remains around 5 million below its pre-pandemic level. At the same time, the number of job vacancies has increased, suggesting previously employed individuals are reluctant or unable to return to the work force.
Chart 1 shows that the U.S. labor market has become increasingly tight throughout 2021. The blue line plots the ratio of nonfarm job openings to the number of nonfarm unemployed (excluding temporary layoffs), a common measure of labor market tightness. The ratio has bounced back from its low during April 2020 and now exceeds pre-pandemic levels. Although total employment has also recovered (green line), it remains significantly below pre-pandemic levels.
Chart 1: National (Nonfarm) Labor Market Tightness Has Recovered More than Employment
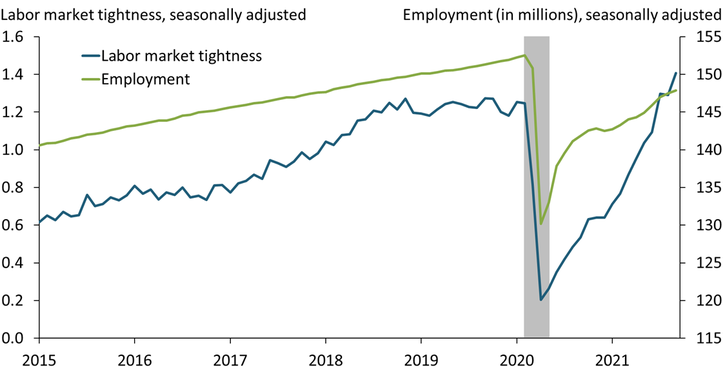
Note: The gray shaded bar indicates a National Bureau of Economic Research (NBER)-designated recession.
Sources: U.S. Bureau of Labor Statistics (BLS), U.S. Census Bureau, NBER, and authors’ calculations.
Monetary policy may have limited scope to boost employment when labor markets are tight. Generally, accommodative monetary policy is thought to boost employment by stimulating the economy and thereby increasing the number of available jobs. However, recent evidence from Nie and Yang (2021), Scheid (2021), and others suggests that many workers are reluctant or unable to return to the labor force due to health concerns or caring for family members.
Labor markets appear tight on the national level. However, this aggregate view masks the uneven recovery across U.S. states. Chart 2 shows the percent change in labor market tightness for all U.S. states (including Washington, D.C.) from February 2020 to September 2021. In 36 states, labor markets have become tighter than they were before the pandemic. In 10 states, labor market tightness has exceeded pre-pandemic levels by more than 50 percent, with the most significant uptick in Kentucky (+70 percent), Georgia (+92 percent), and Nebraska (+114 percent). Conversely, labor markets in 15 states (including D.C.) are less tight than they were before the pandemic, though the gap for most states is relatively small. Hawaii is an exception, with a 67 percent decline in labor market tightness: Daysog (2021) emphasizes that former employees in the hotel, food services, and transportation industries in Hawaii were not rehired despite the surge in visitors over the summer. Overall, Chart 2 suggests sizable variation across U.S. states in terms of the pandemic-related labor market recovery.
Chart 2: Nonfarm Labor Market Tightness Relative to Pre-Pandemic Levels Varies across States
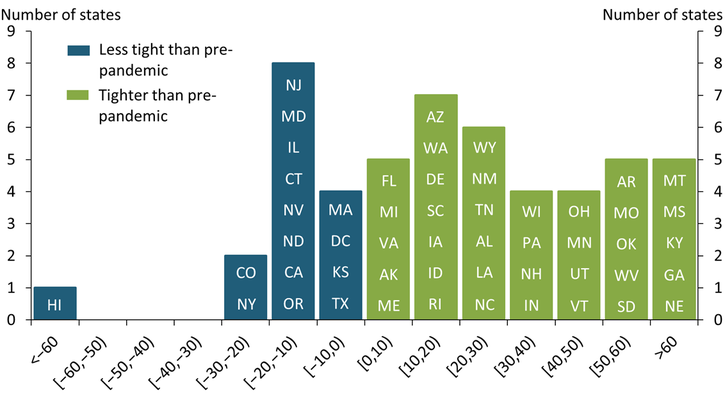
Notes: The horizontal axis displays the percent change in nonfarm labor market tightness between September 2021 and February 2020 for all U.S. states (including Washington, D.C.). The states are grouped into intervals of 10 percent.
Sources: BLS, U.S. Census Bureau, and authors’ calculations.
Is this variation across states a new feature of the pandemic or consistent over time? To better illustrate long-term variation in labor market tightness across states, Chart 3 plots the national measure of labor market tightness shown in Chart 1 (blue line) together with the standard deviation of labor market tightness across states in each month (green line)._ A larger standard deviation points to greater variation in tightness across states.
Chart 3: Dispersion in Nonfarm Labor Market Tightness across U.S. States at Historic High
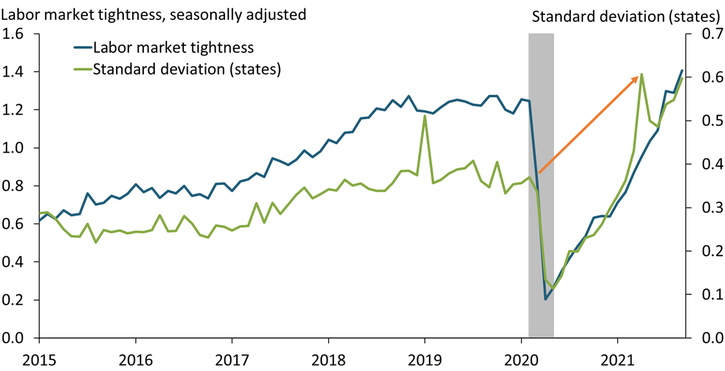
Notes: The gray shaded bar indicates an NBER-designated recession. The standard deviation is calculated using the state-level, nonfarm labor market tightness series.
Sources: BLS, U.S. Census Bureau, NBER, and authors’ calculations.
The chart shows that as labor markets have grown tighter overall, the variation in tightness across states also increased. Some of the increase in the standard deviation is expected because of a level effect: if labor markets are tight, then a 1 percent deviation from this level for some states leads to a higher standard deviation compared with a 1 percent deviation from a lower level. However, the current level of dispersion in labor market tightness is extraordinary even accounting for level effects. The standard deviation is at its highest level in more than two decades. The orange arrow highlights that while labor markets are only marginally tighter than they were before the pandemic overall, the dispersion across states is much higher relative to pre-pandemic levels.
Overall, employment is still about 5 million below pre-pandemic levels and labor market conditions differ widely across states, implying an uneven recovery. The dispersion in labor market tightness suggests that state-specific factors play a major role. States may therefore benefit from tailored fiscal policies that are specifically designed to accommodate local labor market conditions.
Endnotes
-
1
The standard deviation measures the spread around an average. Thus, if all states had the same level of labor market tightness, the standard deviation would be zero. Dispersion increases the standard deviation.
References
Albert, Sarah, Andrew Foerster, and Pierre-Daniel G. Sarte. 2021. “External LinkEmployment Effects of COVID-1across States, Sectors.” Federal Reserve Bank of San Francisco, Economic Letter, November 22.
Daysog, Rick. 2021. “External LinkHawaii’s Economy Is on the Rebound, but Experts Say the Job Market Is Lagging Behind.” Hawaii News Now, August 3.
Kaplan, Robert S., Tyler Atkinson, Jim Dolmas, Marc P. Giannoni, and Karel Mertens. 2021. “External LinkThe Labor Market May Be Tighter than the Level of Employment Suggests.” Federal Reserve Bank of Dallas, Dallas Fed Economics, May 27.
Nie, Jun, and Shu-Kuei Yang. 2021. “External LinkWhat Has Driven the Recent Increase in Retirements?” Federal Reserve Bank of Kansas City, Economic Bulletin, August 11.
Scheid, Brian. 2021. “External LinkDespite Hot Job Market, Millions Reluctant to Return to Work Force.” S&P Global Market Intelligence, November 9.
Pissarides, Christopher. 2000. Equilibrium Unemployment Theory, 2nd Edition. Cambridge, MA: MIT Press.
Tasci, Murat, and Caitlin Treanor. 2018. “External LinkLabor Market Tightness across the United States since the Great Recession.” Federal Reserve Bank of Cleveland, Economic Commentary, January 16.
Johannes Matschke is an economist at the Federal Reserve Bank of Kansas City. Sai A. Sattiraju is a research associate at the bank. The views expressed are those of the authors and do not necessarily reflect the positions of the Federal Reserve Bank of Kansas City or the Federal Reserve System.