Pandemic-related disruptions and imbalances in the supply and demand of goods and services pushed inflation to multidecade highs in 2022. Although inflation has trended down since, it remains around 5 percent as of April 2023—significantly higher than the Federal Reserve’s long-run objective._ Sustained periods of elevated inflation pose particular risks for the economy. It is widely believed that the longer inflation remains elevated, the greater the risk that high inflation will become self-reinforcing and thus embedded in the economy. For example, workers experiencing high inflation are more likely to demand higher wages to compensate for rising costs. These higher wage costs, together with other increasing input costs, can cause firms to increase their prices to protect profit margins. In economic theory, this phenomenon is described as a wage-price spiral.
One way to gauge the persistence of current inflation—and thus, whether the current high rate of inflation could become embedded in the economy—is to look at underlying inflation. Underlying inflation is the rate of inflation that will prevail once temporary imbalances in the economy resolve (Rudd 2020). A sustained upward shift in underlying inflation indicates that inflation is likely to remain even after the economy rebalances.
Chart 1 shows underlying inflation generated by a version of the statistical model in Stock and Watson (2007) alongside a measure of actual inflation—the annualized log difference of the Consumer Price Index (CPI). In decades prior to the pandemic, measures of underlying inflation from this statistical model fluctuated in the near vicinity of 2 percent, reflecting the stability of inflation in the United States. More recently, however, measures of underlying inflation have risen well above 2 percent, raising concerns that long-run inflation will move higher than the Federal Reserve’s long-run objective.
Chart 1: Estimate of underlying inflation has risen since the pandemic
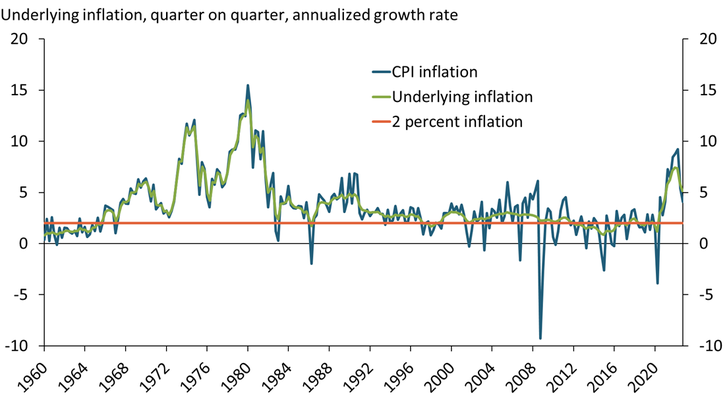
Notes: Data end in 2022:Q4. We estimate underlying inflation using the non-centered parameterization of Stock and Watson’s Unobserved Component Stochastic Volatility (UCSV) model as in Chan (2018).
Sources: U.S. Bureau of Labor Statistics (Haver Analytics), Chan (2018), and Stock and Watson (2007).
Because underlying inflation depends on realized inflation, estimating the future path of underlying inflation requires us to make assumptions about the future path of actual inflation._ We thus project the potential path of underlying inflation under two different assumptions: first, that the Survey of Professional Forecasters’ (SPF) inflation expectations will become realized; and second, that inflation will surprise to the upside of the SPF forecasts but slowly return to the long-run trend forecast.
As a first step, Chart 2 shows how actual inflation might evolve under the two assumptions. The blue line shows that if forecasters’ inflation expectations from the SPF are realized, actual inflation should steadily decline toward 2 percent by 2024. However, the green line shows that if inflation surprises to the upside—for example, due to unforeseen future imbalances putting upward pressure on inflation, the lags of monetary policy being longer and more variable than currently thought, or higher inflation becoming embedded in the economy—then the tapering of inflation could slow. The slow pace at which inflation declines under this assumption is comparable to the unwinding of the high-inflation episodes of the 1970s and 1980s.
Chart 2: Hypothetical paths of inflation
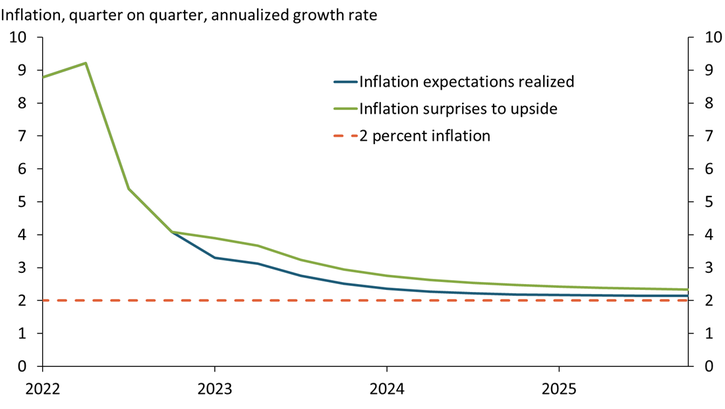
Sources: U.S. Bureau of Labor Statistics (Haver Analytics) and authors’ calculations.
Based on these paths for realized inflation, Chart 3 shows our projections for underlying inflation under both assumptions. The blue line shows that if SPF forecasts are realized, the path of underlying inflation would trend to 2 percent by the middle of 2024. However, the green line shows that if inflation surprises to the upside in the coming quarters, underlying inflation would not converge to 2 percent until much later in the decade. Under this scenario, underlying inflation could be close to 3 percent next year.
Chart 3: Path of underlying inflation depends on future realizations of inflation
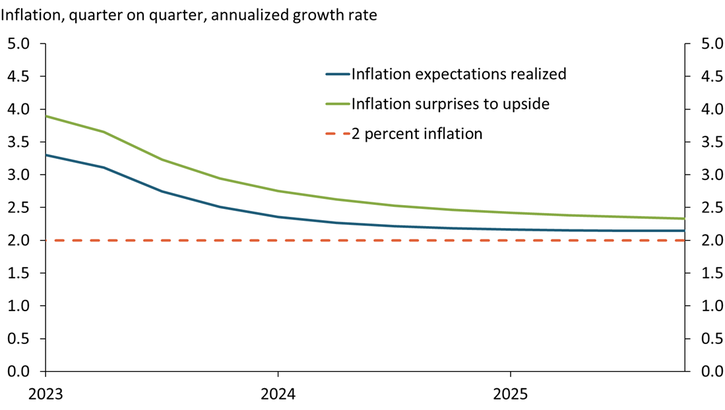
Sources: U.S. Bureau of Labor Statistics (Haver Analytics) and authors’ calculations.
Our analysis shows that while underlying inflation could ease to near 2 percent sometime next year, its path depends crucially on the evolution of future inflation. We also show that if inflation surprises to the upside and decays more slowly, underlying inflation could converge to approximately 3 percent and risk becoming embedded in the economy. Therefore, the longer inflation stays elevated, the more difficult it may be for the Federal Reserve to reach its mandate of price stability.
Endnotes
-
1
Although the Federal Reserve’s 2 percent inflation target is based on the price index for personal consumption expenditures (PCE), we measure inflation using the CPI due to the availability of data for the term structure of inflation expectations from Aruoba (2016). Generally, CPI inflation runs a little higher than PCE inflation (Bullard 2013).
-
2
In Charts 2 and 3, we estimate the path of inflation for the “inflation expectations realized” scenario using the term structure of inflation expectations from Aruoba (2016), which are contiguous inflation expectations estimated from data from the SPF, Blue Chip Economic Indicators, and Blue Chip Financial Forecasts. To estimate the path of inflation for the “inflation surprises to the upside” scenario, we add a surprise term to the quarterly Arouba-based forecasts that decays geometrically at a rate of 0.9. The first surprise (added to 2023:Q1) is 0.6 percentage points. For example, the surprise term at 2023:Q2 is 0.6 × 0.9, and the surprise term at 2023:Q3 is 0.6 × 0.92. We truncate the graphs at 2025:Q4, but the Aruoba term structure of inflation expectations extends to 2033:Q1.
References
Aruoba, S. Borağan. 2016. “External LinkTerm Structures of Inflation Expectations and Real Interest Rates.” Federal Reserve Bank of Philadelphia, working paper no. 16-09/R, September 20.
Bullard, James. 2013. “External LinkCPI vs. PCE inflation: Choosing a Standard Measure.” Federal Reserve Bank of St. Louis, Regional Economist, July 1.
Chan, Joshua C. C. 2018. “External LinkSpecification Tests for Time-Varying Parameter Models with Stochastic Volatility.” Econometric Reviews, vol. 37, no. 8, pp. 807–823.
Rudd, Jeremy B. 2020. “External LinkUnderlying Inflation: Its Measurement and Significance.” Board of Governors of the Federal Reserve System, FEDS Notes, September 18.
Stock, James H., and Mark W. Watson. 2007. “External LinkWhy Has U.S. Inflation Become Harder to Forecast?” Journal of Money, Credit and Banking, vol. 39, no. 1, pp. 3–33.
Amaze Lusompa is an economist at the Federal Reserve Bank of Kansas City. Sai A. Sattiraju is a research associate at the bank. The views expressed are those of the authors and do not necessarily reflect the positions of the Federal Reserve Bank of Kansas City or the Federal Reserve System.