The U.S. dollar has appreciated more than 8.5 percent since May 2021. Chart 1 plots a trade-weighted index of the nominal U.S. dollar against 26 foreign currencies from 2013 to 2022. The appreciation since 2021 is clearly visible, as the index has increased almost continuously since 2021. However, the recent increase in the index is much smaller than the increase during 2013–15, a period when the dollar appreciated due to weak emerging market and European growth rates.
Chart 1: The recent appreciation in the U.S. dollar has been modest
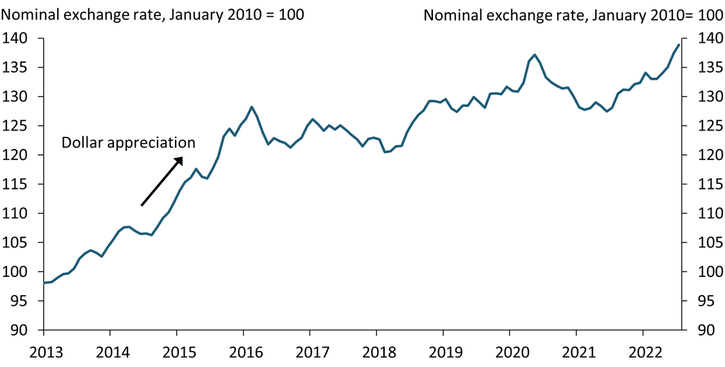
Sources: Board of Governors of the Federal Reserve System, Pacific Exchange Rate Service, and authors’ calculations.
Some news outlets and policymakers have suggested that the recent appreciation of the dollar could help mitigate inflationary pressures in the United States (Ngo 2022; Lynch 2022). The effect of appreciation on domestic inflation depends heavily on how U.S. imports are invoiced. If imports are billed in foreign currencies, then a strong dollar would indeed reduce the U.S. dollar price of imports, thereby dampening inflation. However, the United States invoices more than 95 percent of its imports in U.S. dollars (Goldberg and Tille 2008; Boz and others 2022). Changes in the value of the U.S. dollar therefore have no immediate effect on import prices. Instead, effects unfold over time, as producers gradually adjust their prices.
To illustrate the effect of exchange rates on domestic inflation, Chart 2 plots year-over-year core PCE inflation (blue line) alongside the contribution from trade-weighted fluctuations in the exchange rate (orange bars) and the contribution from import prices in U.S. dollars (excluding food and energy prices, green line)._ Two patterns are striking. First, domestic inflationary pressures tend to decrease whenever the U.S. dollar appreciates. During 2013–15, the dollar appreciated by roughly 25 percent, which provided a sizable, delayed drag on core PCE inflation of 0.53 percentage points by the end of 2015. However, a more muted U.S. dollar appreciation implies a more modest drag on inflation. In particular, our calculations suggest that the recent appreciation in the U.S. dollar reduced inflation by only 0.16 percentage points annualized as of June 2022, even though the effect is likely to increase over the second half of 2022 as firms gradually adjust prices. Second, the link between import prices and exchange rates appears to have broken down in early 2020. Although contributions from import prices and exchange rates have moved together for most of the past decade, over the last two years, import prices seem to be primarily driven by the imbalance between surging demand for imported goods and disrupted supply. Therefore, import prices have increased (contributing positively to inflation) even as the U.S. dollar has appreciated (contributing negatively to inflation).
Chart 2: The current U.S. dollar appreciation has a small effect on core PCE inflation
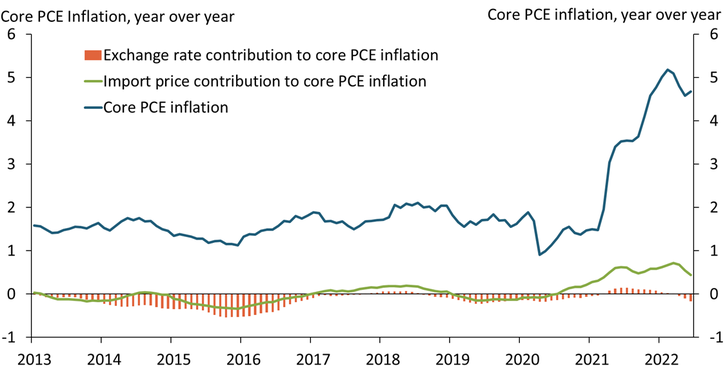
Sources: U.S. Bureau of Economic Analysis (BEA), U.S. Bureau of Labor Statistics (BLS), Board of Governors of the Federal Reserve System, Pacific Exchange Rate Service, and authors’ calculations.
Although the recent appreciation in the dollar has had only a small dampening effect on inflation thus far, future fluctuations in the exchange rate could alter this path. Chart 3 illustrates how three possible exchange rate scenarios could affect the contribution toward core PCE. The “no change” scenario (green dashed line) assumes that the trade-weighted exchange rate remains unchanged during the remainder of 2022 and in 2023. The “appreciation” scenario (orange dashed line) assumes the U.S. dollar continues to moderately appreciate by 5 percent until the end of 2023, reflecting potentially widening interest rate differentials or a further divergence in the economic outlook between the United States and major trading partners. Finally, the “depreciation” scenario (purple dashed line) assumes that the U.S. dollar depreciates by 2.9 percent until the end of 2023, which we derive from a purchasing power parity benchmark._
Chart 3: A sizable impact of the exchange rate on core PCE inflation is unlikely in 2022/2023
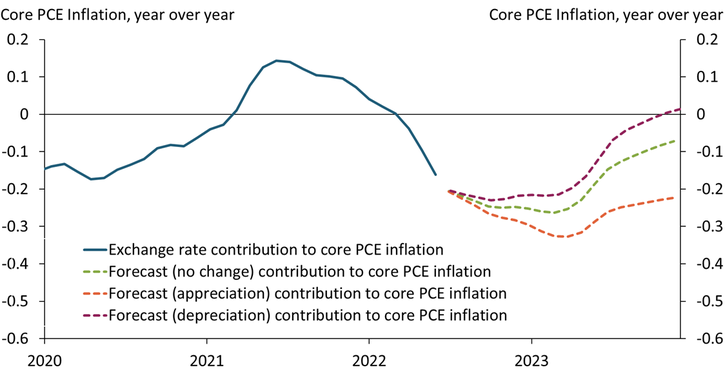
Sources: BLS, Board of Governors of the Federal Reserve System, Pacific Exchange Rate Service, and authors’ calculations.
Even though the contribution to core PCE inflation varies somewhat, the overall drag on domestic inflation remains small under all three scenarios. The projection for the “no change” scenario (green dashed line) highlights the delayed response of import prices to exchange rate fluctuations: with no further appreciation, the peak effect of the recent appreciation in the dollar will not be reached until early 2023. Even then, the recent appreciation would only modestly lower inflation by 0.26 percentage points annualized. In contrast, if the U.S. dollar appreciated further by additional 5 percent (orange dashed line), the peak drag on core PCE inflation would materialize somewhat later. However, the effect is still small at about 0.33 percentage points annualized; a much more sizable appreciation would be necessary to provide a considerable drag on domestic inflation. Finally, the projection for the “depreciation” scenario (purple dashed line) suggests that if the dollar depreciates based on our purchasing power benchmark, core PCE inflation would be reduced by 0.23 percentage points by the end of 2022. In November 2023, the depreciation would then start to increase domestic inflation; however, this effect should be barely noticeable.
Overall, our analysis provides insights into how exchange rate dynamics affect domestic inflation. In recent months, news outlets and policymakers have argued that appreciation in the U.S. dollar may reduce inflation. Our analysis suggests that this effect could be relatively modest unless the appreciation is substantial, as it was during the 2013–15 episode. Even if the exchange rate continues to appreciate modestly, we do not expect a sizable drag on domestic core inflation. Further, over the last two years import prices and exchange rates have moved in the opposite direction, suggesting that current import prices are primarily driven by the imbalance between strong demand for imports and reduced supply due to COVID-19 restrictions and production disruptions.
Download Materials
Endnotes
-
1
The pass-through of exchange rate fluctuations to domestic inflation depends on two factors: the expenditure share on imported goods and the sensitivity of U.S. dollar import prices to exchange rate fluctuations. Regarding the former, consumers spend 10.2 percent of their core personal consumption expenditure (PCE) basket on imports (Hale and others 2019). Regarding the latter, we estimate a linear regression model with monthly import prices (excluding food and energy) as the dependent variable and 12 lags of the trade-weighted exchange rate as the independent variables. To calculate the contribution toward core PCE, we feed actual (or predicted) trade-weighted exchange rates into the statistical model and calculate a hypothetical import price that is solely due to exchange rate movements. Subsequently, we convert the resulting series into growth rates and multiply them by 0.102.
-
2
Purchasing power parity (PPP) is based on arbitrage and states that identical goods must cost the same if expressed in the same currency. PPP does not hold exactly but performs reasonably well at medium or longer horizons. According to this benchmark, the U.S. dollar is currently strong and therefore likely to devaluate. The specific forecast assumes that the current exchange rate converges towards the PPP benchmark at 15 percent per year, a common value in the literature (Feenstra and Taylor 2016).
References
Boz, Emine, Camila Casas, Georgios Georgiadis, Gita Gopinath, Helena Le Mezo, Arnaud Mehl, and Tra Nguyen. 2022. “External LinkPatterns of Invoicing Currency in Global Trade: New Evidence.” Journal of International Economics, vol. 136, May.
Feenstra, Robert C., and Alan M. Taylor. 2016. “International Macroeconomics, Fourth Edition.” Worth Publishers.
Goldberg, Linda, and Cédric Tille. 2008. “External LinkVehicle Currency Use in International Trade.” Journal of International Economics, vol. 76, pp. 177–192.
Hale, Galina, Bart Hobijn, Fernanda Nechio, and Doris Wilson. 2019. “External LinkHow Much Do We Spend on Imports?” Federal Reserve Bank of San Francisco, Economic Letter, January 7.
Lynch, David J. 2022. “External LinkSoaring Dollar Could Help Fed in Fight against Inflation.” Washington Post, July 17.
Ngo, Madeleine. 2022. “External LinkWhat the Strong Dollar Means for You.” Vox, July 28.
Johannes Matschke is an economist at the Federal Reserve Bank of Kansas City. Sai A. Sattiraju is a research associate at the bank. The views expressed are those of the authors and do not necessarily reflect the positions of the Federal Reserve Bank of Kansas City or the Federal Reserve System.