Core inflation, as measured by the 12-month change in the consumer price index (CPI) excluding its volatile food and energy components, rebounded strongly following the 2007–09 recession. Core CPI peaked at 2.3 percent in mid-2012 before falling into a lull, remaining moderately below 2 percent for most of the next three years (Chart 1). More recently, core inflation has again picked up, staying above 2 percent for all of 2016.
Chart 1: Core CPI
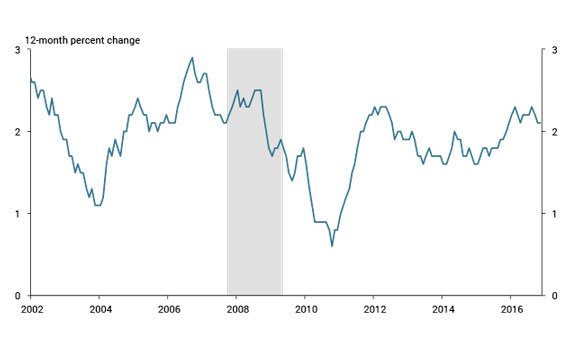
Source: Bureau of Labor Statistics (Haver Analytics).
Compared with mid-2012, however, the current composition of core inflation differs significantly. In 2012, the housing and non-housing components of core inflation were increasing at similar rates. Today, housing rent—the actual rent on leased units and the estimated rent on owner-occupied units—exceeds the non-housing portion of core inflation by more than 2 percentage points (Chart 2). As housing rent accounts for more than 40 percent of the core CPI, its current high growth rate is significantly boosting core inflation._
Chart 2: Rent and non-rent core CPI components
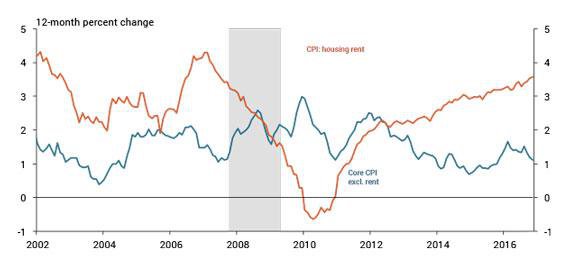
Source: Bureau of Labor Statistics (Haver Analytics).
The current boost to core inflation from housing rent is not unusual. From 1970 to 2008, rent inflation outpaced non-rent core inflation by an annual average of 1.3 percentage point. The higher rate of rent inflation largely reflects technological progress that lowered the cost of providing many goods and non-housing services relative to the cost of providing housing services.
More unusual is the narrow geographic basis of the current boost. Rent inflation in the West census region was 5.2 percent in November 2016, up 3 percentage points from mid-2012. In the rest of the United States, rent inflation was 2.9 percent, only modestly up from mid-2012 (Chart 3).
Chart 3: Housing rent by region
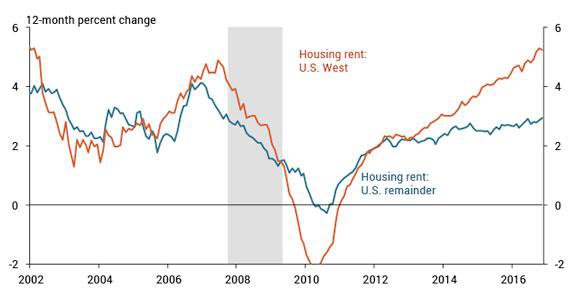
Note: Data shown through November 2016. Rent inflation for the rest of the United States is the average of housing rent inflation in the Northeast, Midwest and South Census Regions.
Source: Bureau of Labor Statistics (Haver Analytics).
The current high rent inflation in the western United States rests disproportionately on just four metropolitan areas: Denver, Portland, Seattle, and San Francisco-San Jose. Rents in each of these metros increased by at least 5.7 percent from 2015:H1 to 2016:H1, well above the gains in any other metros for which the BLS separately measures prices (Chart 4). These four metros also had the highest cumulative rent inflation over the previous four years.
Several factors are likely driving up rent inflation in these four metros. On the demand side, highly paid workers have been increasingly clustering in Seattle, Portland, and San Francisco-San Jose, pushing up average household income and demand for housing (Moretti). Strong population growth in Denver, among the fastest in the nation, has also boosted housing demand. On the supply side, the geography of the western United States—ocean and mountains—has significantly constrained new home construction in each of the four metros. In addition, Denver, Seattle, and San Franciso-San Jose have some of the tightest land-use restrictions among large U.S. metros, and the Portland metro has an urban growth boundary that severely limits new construction at its periphery (Gyourko, Saiz, and Summers).
Chart 4: Housing rent in select metropolitan areas
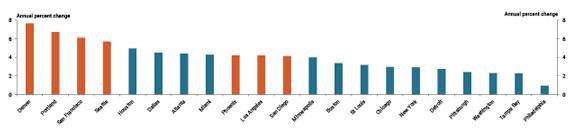
Note: Chart shows the increase in the shelter component of the CPI from 2015:H1 to 2016:H1. Orange bars indicate metros located in the West Census Region. The chart includes the 21 metros for which the BLS reports price indices that have at least 1 percent weight in aggregate CPI. Monthly data through November, available for a subset of metros, shows rent inflation recently picked up in Dallas and decelerated in Houston.
Source: Bureau of Labor Statistics (Haver Analytics).
Looking forward, rents in Denver, Portland, Seattle, and San Francisco-San Jose may continue to rise more quickly than elsewhere for some time. Over the longer term, however, the rising relative cost of living in these metros is likely to dampen housing demand and thus curb rent inflation.
Endnotes
-
1
We measure housing rent by the shelter component of the CPI. A small portion of the shelter component is housing away from home, primarily vacation stays at hotels and dormitory living for college students. Housing rent receives a much smaller weight in the personal consumption expenditure (PCE) price index, which is the Federal Reserve’s preferred inflation measure.
References
Gyourko, Joseph, Albert Saiz, and Anita Summers. 2008. “External LinkA New Measure of the Local Regulatory Environment for Housing Markets: The Wharton Residential Land Use Regulatory Index.” Urban Studies, vol. 45, no. 3, pp. 693–729.
Moretti, Enrico. 2012. The New Geography of Jobs. Boston: Houghton Mifflin Harcourt.
Jordan Rappaport is a senior economist at the Federal Reserve Bank of Kansas City. Michael Redmond is an associate economist at the bank. The views expressed are those of the authors and do not necessarily reflect the positions of the Federal Reserve Bank of Kansas City or the Federal Reserve System.