Balances on outstanding and new small business commercial and industrial (C&I) loans increased in the first quarter of 2021, due primarily to a second round of lending through the Small Business Administration’s (SBA) Paycheck Protection Program (PPP) that began in January. Outstanding small business C&I loan balances increased 62.5 percent compared with the first quarter of 2020 and 6.1 percent compared with the previous quarter. Balances on new small business C&I loans increased by 392.4 percent and 444.1 percent, respectively, during the same periods. On net, the 109 respondents to the survey reported increased loan demand with tightening credit standards and loan terms. While respondents reported declining credit quality for a fifth consecutive quarter, fewer banks, on net, reported a decrease.
Chart 1: Small Business C&I Loan Balances Increase Year-over-Year and Quarter-over-Quarter
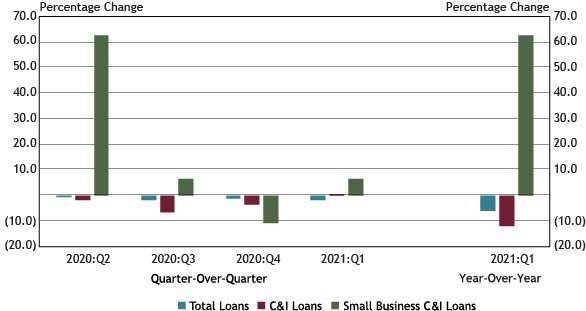
Note: Items are calculated using a subset of 87 respondents that completed the FR 2028D for the last five quarters surveyed.
Sources: Call Report, schedule RC-C Part I, items 4. Commercial and Industrial Loans and 12. Total loans and leases held for investment and held for sale; and FR 2028D, items 4.b and 5.c.
Small business C&I loan balances increased 62.5 percent year-over-year bolstered by outstanding loans guaranteed by the SBA through the PPP, the seventh consecutive quarter of year-over-year increases. Total loan and C&I loan balances decreased year-over-year, decreasing 6.0 percent and 12.1 percent, respectively. Small business C&I loan balances increased 6.1 percent quarter-over-quarter, following a decrease in the fourth quarter of 2020._
Chart 2: Outstanding Loan Balances Secured by SBA Guarantees Rebound from Previous Quarter Decline
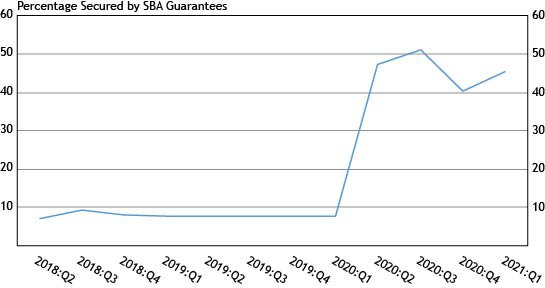
Source: FR 2028D, Special Question.
The percentage of outstanding small business C&I loan balances secured by the SBA rebounded from 40 to 45 percent, following a decline in the fourth quarter of 2020 related to the close of the PPP lending program and increased loan forgiveness. The increase in the first quarter can be attributed primarily to the second round of PPP loan originations that began in January 2021.
Chart 3: New Small Business C&I Loan Balances Increase Quarter-Over-Quarter and Year-Over-Year
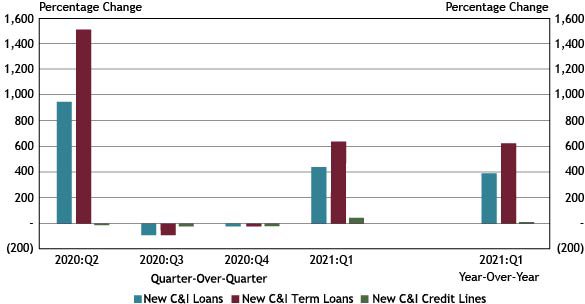
Note: Items are calculated using a subset of 87 respondents that completed the FR 2028D for the last five quarters surveyed. All loan types referenced in Chart 3 refer to small business lending.
Source: FR 2028D, items 7.b and 10.c.
Balances on new small business C&I loans increased 444.1 percent in the first quarter compared with the previous quarter, driven by an increase of 622.7 percent in new small business C&I term loans, due primarily to the resumption of PPP lending in January. Compared with the first quarter of 2020, new small business C&I lending increased 392.4 percent, also driven by an increase of 616.5 percent in new small business C&I term loans.
Chart 4: Credit Line Usage Decreases
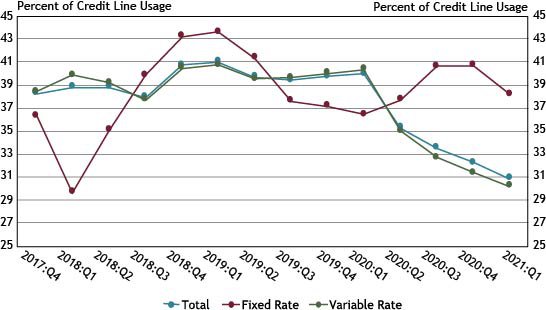
Source: FR 2028D, items 5.b and 5.c.
Use of fixed rate small business C&I lines of credit decreased from 40.7 percent in the fourth quarter of 2020 to 38.2 percent in the first quarter of 2021, while variable rate small business C&I credit line usage decreased for a fourth consecutive quarter to 30.2 percent. Total small business C&I credit line usage decreased from 32.2 percent in the fourth quarter of 2020 to 30.8 percent in the first quarter of 2021.
Chart 5: Interest Rates Decrease Across Most New Loan Categories
Note: Items are calculated using a subset of 87 respondents that completed the FR 2028D for the last five quarters surveyed.
Source: FR 2028D, items 7.c and 8.d.
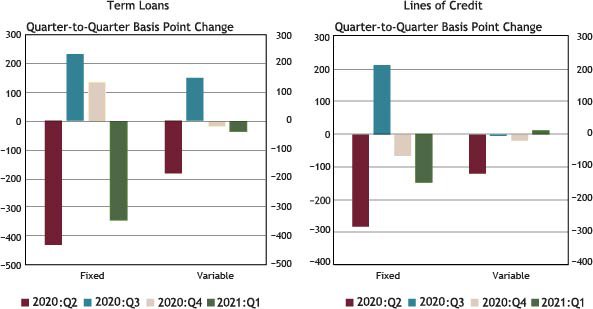
Weighted average rates on new fixed and variable rate term loans, and fixed rate lines of credit decreased in the first quarter, with variable rate lines of credit remaining relatively stable. The largest decrease, 343 basis points, was reported for fixed rate term loans. The decrease in fixed rates for term loans primarily can be attributed to the resumption of low interest rate PPP loan originations in January.
Chart 6: Interest Rates on Term Loans Lower than Interest Rates on Lines of Credit
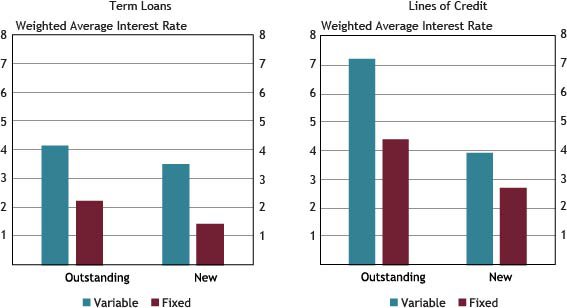
Note: Average interest rates are weighted by the dollar volume of new small business C&I loans.
Source: FR 2028D, items 4.c, 5.d, 7.c and 8.d.
Weighted average interest rates on variable and fixed rate new and outstanding small business C&I term loans and lines of credit ranged from 1.40 percent to 7.24 percent in the first quarter. The weighted average interest rates for small business C&I term loans were lower than the corresponding rates for small business lines of credit. Weighted average fixed and variable rate outstanding lines of credit were the highest, at 4.41 and 7.24 percent, respectively, while weighted average rates on fixed rate outstanding and new term loans were the lowest, at 2.23 and 1.40 percent, respectively. Lower rates on fixed rate term loans primarily can be attributed to low interest rates on loans secured by the SBA through the PPP.
Chart 7: Percentage of New Small Business C&I Loans with Interest Rate Floors Decreases
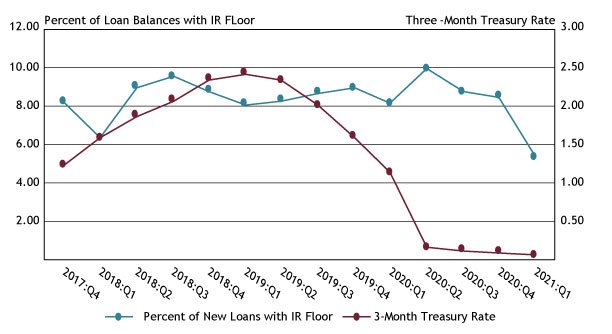
Source: FR 2028D, items 7.a, 7.f, 8.a and 8.e, Federal Reserve Bank of St. Louis, 3-Month Treasury Constant Maturity Rate
The percent of new small business C&I loans with interest rate floors declined from 8.4 percent to 5.2 percent in the first quarter. The 3-Month U.S. Treasury Rate declined slightly from 0.09 percent to 0.05 percent during the same period.
Chart 8: Respondents Report Decrease in Credit Line Usage
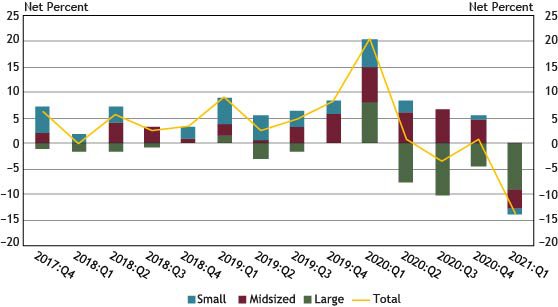
Notes: Chart 8 shows diffusion indexes for credit line usage. The diffusion indexes show the difference between the percent of banks reporting decreased credit line usage and those reporting increased credit line usage. Net percent refers to the percent of banks that reported having decreased (“decreased somewhat” or “decreased substantially”) minus the percent of banks that reported having increased (“increased somewhat” or “increased substantially”).**
Source: FR 2028D, items 11 and 12.
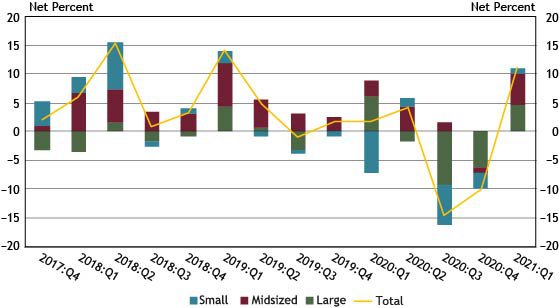
The percentage of respondents indicating a change in credit line usage, whether an increase or decrease, increased from 36 percent in the fourth quarter of 2020 to 38 percent in the first quarter of 2021. On net, about 14 percent of respondents indicated a decrease in credit line usage, primarily driven by large banks. This is the first time since the start of the survey that a net decrease in credit line usage has been reported for all three bank sizes and is the largest aggregate net decrease in credit line usage. Of banks reporting a change in credit line usage, 73 percent cited change in local or national economic conditions and 59 percent cited change in a borrower’s business revenue or other business specific conditions as very important reasons for a change.
Chart 9: Respondents Report Stronger Loan Demand
Notes: Chart 9 shows diffusion indexes for loan demand. The diffusion indexes show the difference between the percent of banks reporting weakened loan demand and those reporting stronger loan demand. Net percent refers to the percent of banks that reported having weakened (“moderately weaker” or “substantially weaker”) minus the percent of banks that reported having stronger loan demand (“moderately stronger” or “substantially stronger”).
Source: FR 2028D, item 13.
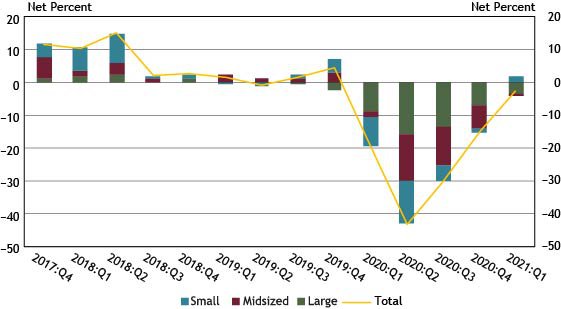
In the first quarter, about 44 percent of banks reported a change in loan demand. All three bank sizes reported stronger loan demand on net, with large banks and midsized banks reflecting a net increase of about 5 percent and 6 percent, respectively. This is the first time since the first quarter of 2019 in which all three bank sizes reported a net increase in loan demand.
Chart 10: Application Approval Rates for Midsized and Large Banks Increase
Source: FR 2028D, items 14.a and 15.
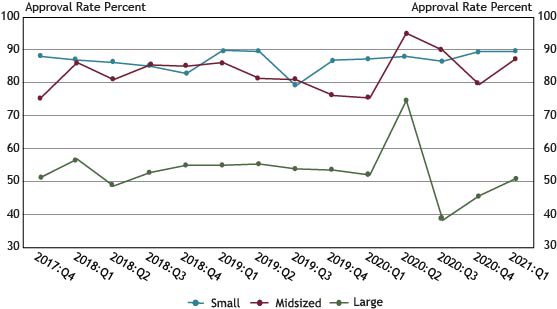
Application approval rates for midsized banks increased from 80 percent in the fourth quarter of 2020 to 87 percent in the first quarter of 2021. In the same quarter, approval rates for large banks increased from 46 percent to 51 percent, while approval rates at small banks remained unchanged at 90 percent. The three most commonly cited reasons for denying a loan were borrower financials, collateral, and credit history.
Chart 11: Fewer Banks On Net Report Decrease in Credit Quality
Notes: Chart 11 shows diffusion indexes for credit quality of applicants. The diffusion indexes show the difference between the percent of banks reporting a decline in credit quality and those reporting improvement in credit quality. Net percent refers to the percent of banks that reported declining credit quality (“declined somewhat” or “declined substantially”) minus the percent of banks that reported improving credit quality (“improved somewhat” or “improved substantially”).
Source: FR 2028D, items 20 and 21.
In the first quarter, about 3 percent of banks, on net, reported a decrease in the credit quality of applicants. While this is the fifth consecutive period in which respondents aggregately reported decreasing credit quality, there were fewer banks, on net, reporting a decrease. Small banks reported a net increase of about 2 percent during the period, reversing a four-quarter decline. Of the respondents reporting a change in credit quality, whether an increase or decrease, 55 percent cited the debt-to-income level of business borrowers as a very important reason for a change. Other commonly cited reasons for a change included liquidity position of borrowers and recent business income growth.
Chart 12: Banks Tighten Credit Standards and All Loan Terms
Notes: Chart 12 shows diffusion indexes for credit standards (red bar) and various loan terms. The diffusion indexes show the difference between the percent of banks reporting tightening terms and those reporting easing terms. Net percent refers to the percent of banks that reported having tightened (“tightened somewhat” or “tightened considerably”) minus the percent of banks that reported having eased (“eased somewhat” or “eased considerably”).
Source: FR 2028D, items 16, 17, 18 and 19.
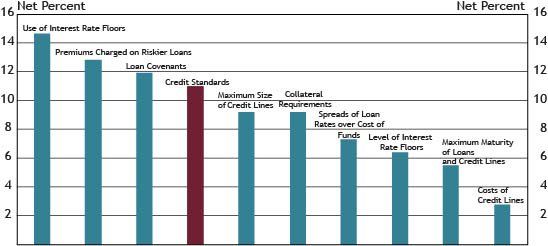
About 20 percent of respondents reported a change in credit standards in the first quarter of 2021, down about 4 percent from the fourth quarter of 2020. Of banks indicating a change in credit standards, 11 percent on net reported tightening their credit standards (Chart 12), a decline of about 10 percent from the previous quarter.
On net, respondents indicated that all loan terms tightened, with use of interest rate floors and premiums charged on riskier loans tightening the most. Respondents reporting tightening credit standards or loan terms in the first quarter cited a less favorable or more uncertain economic outlook, worsening industry specific problems, and reduced tolerance for risk.
* Other contributors to the release include Nicholas Bloom, Rosine Boni, Dan Harbour, Thomas Hobson and Alli Jakubek.
** Small banks have total assets of $1 billion or less, midsized banks have total assets between $1 billion and $10 billion and large banks have total assets greater than $10 billion.
Endnotes
-
1
Due to multiple period revisions by survey respondents, data from 2020 Q2 through 2021 Q1 has been modified and updated. All quantitative charts in the 2021 Q1 release reflect these changes. Affected data elements are footnoted in the aggregate data spreadsheet.