Over the past few years, new home construction has fallen considerably short of rising demand for housing, putting downward pressure on apartment vacancies and existing homes for sale and preventing young adults from forming new households. Increasing rents and sales prices will spur construction growth over the medium term. But the level of home construction is likely to remain low by historical benchmarks, significantly constraining household formation.
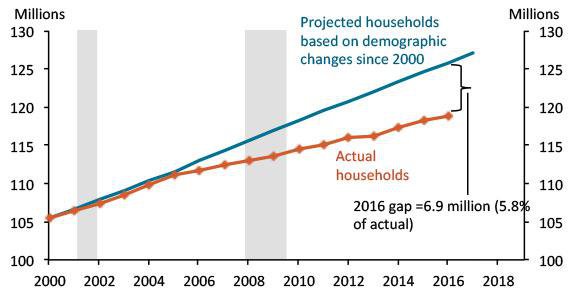
Weak household formation has caused the number of U.S. households to fall increasingly below its trend. The blue line in Chart 1 shows the projected number of U.S. households constructed by keeping the composition of households by age and sex the same as it was in 2000 while adjusting for the evolving composition of the U.S. population (Rappaport 2013). Constructing the number in this way assumes, for example, that the shares of women 25–29 who live on their own, with a single female housemate, or with a single male housemate remain constant at their 2000 values. The orange line shows that the actual number of U.S. households fell below the projected number in 2006, when subprime foreclosures accelerated. The actual number fell further below projection during the recession and even further during the recovery and expansion. By the end of 2016, the actual number of households was 6.9 million below the number projected by holding household composition the same as in 2000.
Chart 1: Actual versus projected U.S. households
Note: Gray bars denote National Bureau of Economic Research (NBER)- defined recessions.
Sources: U.S. Census Bureau (Haver Analytics), IPUMS-USA, NBER (Haver Analytics), and author’s calculations.
Of course, the true trend number of households may not equal the projection, which is based only on the changing demographics of the U.S. population. Long-run changes in household composition, including the increasing share of adults age 25–49 living with their parents since 1980, suggest that the trend path is below the projected path (Rappaport 2015). But the gradual pace of such long-run changes prior to the 2007–09 recession suggests they are unlikely to account for more than half of the shortfall between actual and projected households, leaving the actual number of households at the end of 2016 at least 3.5 million below its trend level.
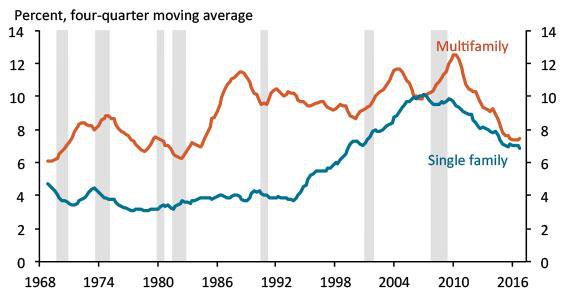
Chart 2: Vacancy rates for rental units
Note: Gray bars denote NBER-defined recessions.
Sources: U.S. Census Bureau (Haver Analytics) and NBER (Haver Analytics).
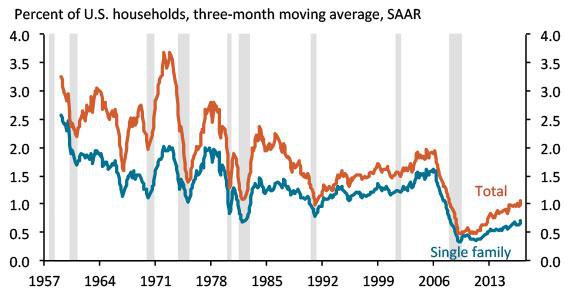
A low supply of housing may explain the gap. The Census Bureau defines a household as an occupied housing unit; household formation thus depends on the availability of apartments and houses to move into. Potential renters have faced the lowest vacancy rates on existing apartments and houses in many years (Chart 2). And while construction of new apartments has boomed over the past few years, it has centered disproportionately on luxury units too expensive for most young adults. Meanwhile, construction of new houses as a share of U.S. households is near its lowest level since at least 1957, the earliest date for which data are available (Chart 3).
A related consequence of this supply shortfall is that spending on housing services—in other words, the estimated rent of all occupied homes—has been one of the slowest growing components of personal consumption over the past few years. Its average growth rate during 2015 and 2016 was 1.5 percent, approximately half the growth rate of consumption of all other goods and services.
Chart 3: Ratio of construction starts to U.S. households
Note: Gray bars denote NBER-defined recessions.
Sources: U.S. Census Bureau (Haver Analytics), NBER (Haver Analytics), and author’s calculations.
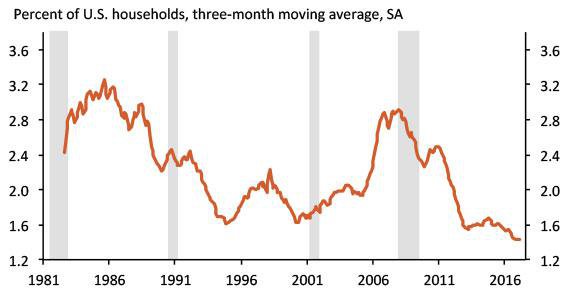
Low single-family home construction is also pushing down both the number of existing single-family homes for sale and apartment vacancies. Existing single-family homes for sale as a share of households is currently at its lowest level since at least 1982, the earliest date for which data are available (Chart 4). Households looking to upgrade to a newly constructed house have faced more limited choices recently than in the past, causing many to decide to remain in their own house rather than listing it for sale. In consequence, households looking to purchase an existing house have also faced more limited choices. The low number of single-family homes available for sale is, in turn, likely to dissuade renters from moving out of their apartments and purchasing homes, thereby pushing down the number of vacant apartments for new households.
Chart 4: Ratio of existing homes listed for sale to U.S. households
Note: Gray bars denote NBER-defined recessions.
Sources: National Association of Realtors (Haver Analytics), NBER (Haver Analytics), U.S. Census Bureau (Haver Analytics), and author’s calculations.
Unsurprisingly, the combination of both limited supply and a large unmet demand for housing is putting strong upward pressure on rents and sales prices. Multifamily rents increased at more than a 4 percent annual rate throughout 2015 and 2016, and increases in single-family rents gradually accelerated from just under a 3 percent rate during the first half of 2015 to a 3.5 percent rate in January 2017 (Chart 5). The annual growth rate of single-family home prices increased from about 5 percent during the first half of 2016 to just over 7 percent in December.
Chart 5: Consumer price index: rent and owner-equivalent rent
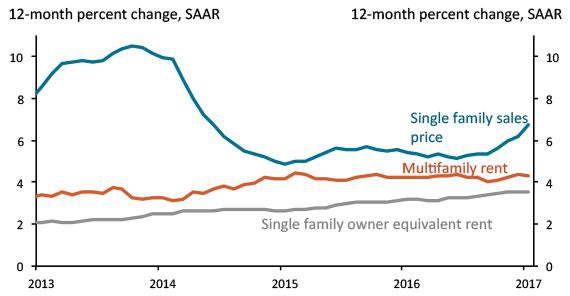
Note: Gray bars denote NBER-defined recessions.
Sources: Bureau of Labor Statistics (Haver Analytics), NBER (Haver Analytics), CoreLogic (Haver Analytics), and author’s calculations.
The heightened pace of price increases has pushed up the national level of home prices to within 5 percent of its 2006 peak, raising concerns of possible overvaluation (Chart 6). In contrast to 2006, however, the current level of home prices appears to be supported by fundamentals rather than speculative demand. In particular, the low rate of current construction suggests demand for single-family homes is unlikely to be met anytime soon. Moreover, the current price-to-rent ratio is only moderately above its 1999–2001 average. Indeed, taking current interest rates into account, house prices may be undervalued, leaving a buffer to absorb downward pressure on sales prices if interest rates continue to rise.
Chart 6: Home price indexes
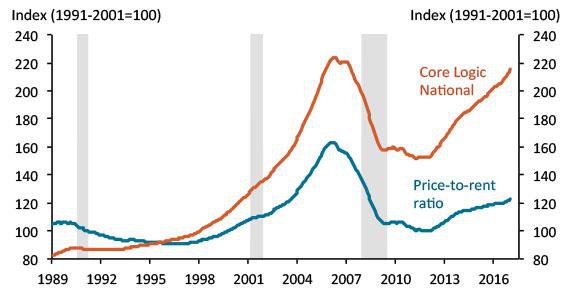
Note: Gray bars denote NBER-defined recessions.
Sources: Bureau of Labor Statistics (Haver Analytics), NBER (Haver Analytics), CoreLogic (Haver Analytics), and author’s calculations.
The large unmet demand for housing is likely to spur growth in home construction during the remainder of 2017 and into 2018. But it is not clear how strong this growth will be, as construction has not responded vigorously to increasing prices thus far. Single-family construction decreased significantly during the first half of 2016 despite strong growth in house prices. One reason is that builders in many metropolitan areas are facing a shortage of qualified construction workers. In addition, smaller builders, which account for the majority of single-family development in some mid-sized metropolitan areas, are having trouble financing land purchases and construction.
A third explanation is the limited availability of undeveloped land in desired locations. From before World War II through the housing boom of the early 2000s, single-family construction largely occurred in new subdivisions near the periphery of metropolitan areas. Over time, this suburban construction migrated further away from the centers of metropolitan areas. In many metros, this outward movement may have reached its geographic limit. Moreover, young professionals’ apparent shift in preferences toward living near urban cores is causing firms to relocate jobs from suburban to central locations. In consequence, meeting demand for single-family housing may require the construction of an increasing share of new homes throughout the interior of metropolitan areas, where limited undeveloped land and zoning restrictions favor smaller-scale projects. Consistent with this land-availability explanation, Rappaport (2017) finds that both single-family and multifamily construction were weaker in metropolitan areas with higher population density throughout their interior portions.
References
Rappaport, Jordan. 2017. "PDFCrowdedness, Centralized Employment, and Multifamily Home Construction." Federal Reserve Bank of Kansas City, Economic Review, vol. 102, no. 1, pp. 41–83.
———. 2015. "PDFMillennials, Baby Boomers, and Rebounding Multifamily Home Construction.” Federal Reserve Bank of Kansas City, Economic Review, vol. 100, no. 2, pp. 37–55.
———. 2013. "PDFThe Demographic Shift from Single-Family to Multifamily Housing." Federal Reserve Bank of Kansas City, Economic Review, vol. 98, no. 4, pp. 29–58.
Jordan Rappaport is a senior economist at the Federal Reserve Bank of Kansas City. The views expressed are those of the author and do not necessarily reflect the positions of the Federal Reserve Bank of Kansas City or the Federal Reserve System.