The U.S. economy has been expanding for 10 years, but home construction continues to sputter. In April, the annual rate of single-family home starts was more than one-quarter below its level in the late 1990s, prior to the housing boom (Chart 1). Excluding its collapse during the Great Recession, the current rate of single-family construction relative to the number of U.S. households is at its lowest since the late 1950s, the earliest date for which data are available. In partial contrast, multifamily apartment construction had fully rebounded from its recessionary collapse by mid-2015. But since then, multifamily construction has remained flat, leaving the combined level of home construction very low by historical benchmarks.
Chart 1: Single-Family and Multifamily Housing Starts
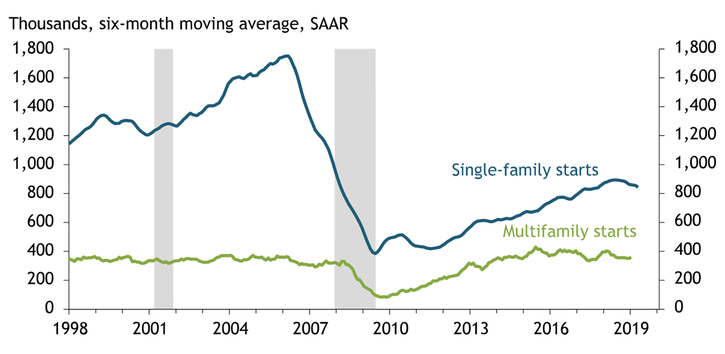
Notes: Gray bars denote National Bureau of Economic Research (NBER)-defined recessions.
Sources: U.S. Census Bureau (Haver Analytics) and NBER (Haver Analytics).
The contrast of solid economic growth with weak home construction suggests supply-side factors are constraining the latter. Briskly growing home prices and rents over the past few years reinforce this interpretation. Sales prices of single-family homes rose steadily at a nearly 6 percent annual rate from late 2014 through early 2018, a 23 percent cumulative increase (Chart 2). Home price growth has since slowed to a 3 percent annual rate, as the cumulative increase in prices along with rising mortgage interest rates have deterred many potential buyers from purchasing a first home or upgrading to a larger one. High prices are thereby bringing the quantity of housing demanded in line with the quantity of housing supplied. But underlying demand for single-family housing—the quantity demanded at each price level—continues to build.
Chart 2: Growth in Single-Family Home Prices
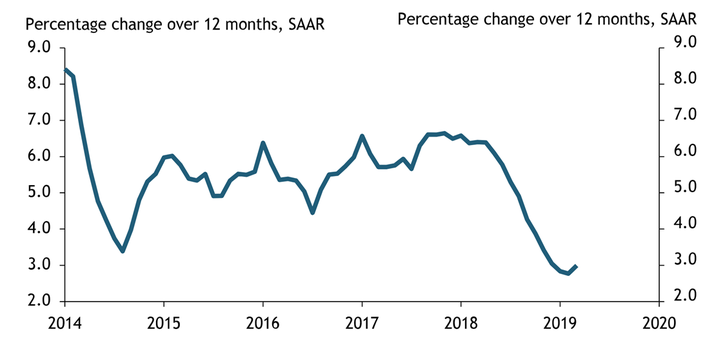
Source: Core Logic (Haver Analytics).
Multifamily construction also appears to be constrained by supply-side factors in the face of strong underlying demand. For example, the current vacancy rate of apartments is very low by historical benchmarks (notwithstanding some saturation in the market for luxury units near metropolitan downtowns), suggesting the supply of apartments is low relative to demand. Consistent with this interpretation, apartment rents have been continually increasing at a close to 4 percent annual rate since late 2014 (Chart 3). In contrast, growth in other consumer prices, as measured by the core Consumer Price Index excluding shelter, has stayed close to 1 percent.
Chart 3: Growth in Multifamily Home Rents
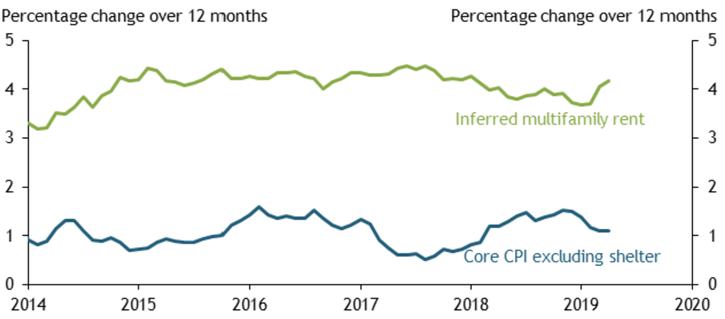
Source: Bureau of Labor Statistics (Haver Analytics).
High home prices and rents are significantly dampening household formation, especially for adults in their twenties and thirties. Chart 4 shows that the share of adults age 25–39 living with their parents increased steadily from 2001 to 2017. This increase was especially strong for adults age 25–29, rising from 15 percent in 2004 to 27 percent in 2017. In addition, many more adults in this age group are living with housemates. For example, the share of adults age 25–29 living with a non-romantic housemate increased by one-third from 2004 to 2017. As a result, the headship rate for people in their twenties and thirties—the number of households headed by someone in this age range per 100 persons in this age range—has been moving steadily down.
Chart 4: Adults Living with Parents
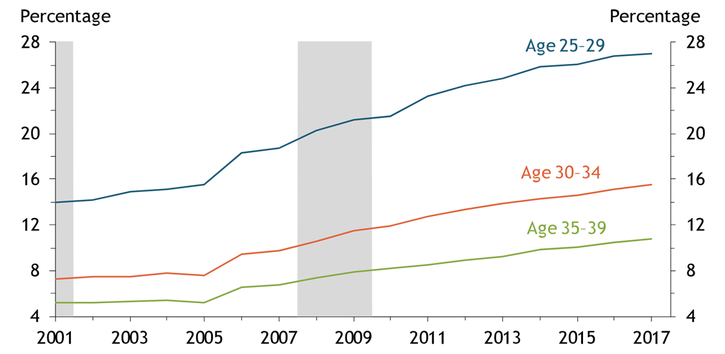
Note: Gray bars denote NBER-defined recessions.
Sources: Census Bureau (Haver Analytics), NBER (Haver Analytics), and author’s calculations.
Reversing the trend of rising rents and declining household formation may require an uptick in home construction in the face of several obstacles. For multifamily construction, land use regulations appear to be the main constraint. In urban areas, builders face maximum density restrictions, caps on permits, and lengthy approval processes. And in suburban areas, minimum lot size and maximum floor space requirements—along with opposition from single-family homeowners—tightly restrict multifamily construction.
For single-family construction, the main constraint appears to be a lack of undeveloped land in desired locations. Until the late 1990s, households eagerly purchased homes in the outer suburbs of metropolitan areas. The relatively low price of land at this periphery and the economies of scale associated with building out new subdivisions allowed developers to profitably sell homes at prices affordable to middle-income households. Today, plentiful open land continues to surround the settled portion of almost all metropolitan areas. But as metros grow and their suburbs creep further away from the city center, the commuting time associated with living at the periphery, along with increasing traffic congestion, has made doing so increasingly undesirable. In many metropolitan areas, suburbanization may have reached its geographic limit. Shifting single-family construction to the settled interior of metropolitan areas limits projects to a smaller scale, pushing up costs. Similarly, the higher price of interior land and the need to tear down existing structures push up costs. To recoup the higher costs of building in the interior, single-family developers have focused on constructing larger, more luxurious houses.
Given the long-term factors constraining home construction, escaping the current housing shortage will take time. Indeed, the lack of available land in desired locations is likely to worsen as the best undeveloped locations within each metropolitan area get built out. In consequence, escaping the housing shortage will partly rely on shifting the balance of home construction toward multifamily units.
Multifamily construction has several benefits over single-family construction in addressing housing shortages. First, multifamily construction economizes land use and so can be more profitable where land prices are relatively high and undeveloped parcels scarce. Second, the deepening penetration of ride-sharing services makes it easier for residents to forego car ownership, in turn lessening parking needs (large parking garages are a major expense in multifamily construction). Third, many firms have been shifting employment from suburban to urban locations, increasing demand to live nearby, where apartments typically predominate. Fourth, the leading edge of the baby boom turns 75 in 2021, the age at which adults increasingly downsize from single-family to multifamily units (Rappaport 2015). The number of people age 75 and older is projected to increase by 12 million from 2021—31, significantly boosting demand for multifamily units. To the extent that the needs and tastes of seniors differ from those of younger adults, much of the increase in demand is likely to require new construction.
Downsizing by baby boomers and the mortality associated with age will also increasingly free up existing single-family homes for re-occupancy. In 2017, seniors age 75 and older vacated about 700,000 single-family homes (Chart 5). Projections suggest this number will accelerate to 900,000 homes per year in 2027 and then to 1 million homes per year in 2031. Younger households who move into these homes from apartments will in turn free up multifamily units for newly forming households.
Chart 5: Single-Family Homes Vacated by Seniors
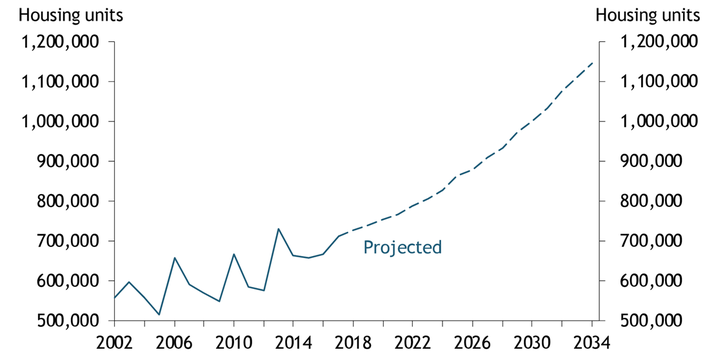
Sources: U.S. Census Bureau (Haver Analytics) and author’s calculations.
Escaping the housing shortage is also likely to require a continuing shift in population from the largest, most crowded metropolitan areas to medium-sized, less densely settled ones. From 2000 to 2017, metros with an initial population from 500,000 to 3 million averaged significantly faster population growth than those with an initial population above 3 million (Rappaport 2018). Similarly, the growth of medium and large metros was significantly negatively correlated with population density. Differences in housing prices and traffic congestion incentivize this population shift. In essence, housing prices and traffic congestion in a number of medium-sized metros currently “undervalue” these metros’ healthy business environments, high amenities, and moderate tax burdens. More generally, the costs associated with proportional increases in population rise sharply as metropolitan areas become very large, allowing medium-sized metros to more easily accommodate national population growth than large ones (Rappaport 2016).
The shift in construction from single-family to multifamily homes and the faster growth of medium-sized metros relative to the largest metros are likely to occur regardless of public policy. However, policies may help quicken the escape from the housing shortage. Revising land use regulations to allow for denser settlement might be especially beneficial. So, too, might policies in medium-sized metropolitan areas that increase their attractiveness to businesses and residents. For example, improved transportation infrastructure, consolidated permitting and licensing, and support for metro-wide amenities such as continuing education, museums, sports teams, and the arts may strengthen the pull of medium-sized metropolitan areas while widely benefiting existing businesses and residents.
References
Rappaport, Jordan. 2018. “External LinkThe Faster Growth of Larger, Less Crowded Locations.” Federal Reserve Bank of Kansas City, Economic Review, vol. 103, no. 4, pp. 5–38.
———. 2016. “External LinkProductivity, Congested Commuting, and Metro Size.” Federal Reserve Bank of Kansas City, Research Working Paper no. 16-03, January.
———. 2015. “Millennials, Baby Boomers, and Rebounding Multifamily Home Construction.” Federal Reserve Bank of Kansas City, Economic Review, vol. 100, no. 2, pp. 37–55.
Jordan Rappaport is a senior economist at the Federal Reserve Bank of Kansas City. The views expressed are those of the author and do not necessarily reflect the positions of the Federal Reserve Bank of Kansas City or the Federal Reserve System.