The COVID-19 pandemic has transformed how Americans work, but not everyone has been affected equally. We provide a high-frequency proxy for work-from-home behavior and assess how work from home has evolved over time and across income, race, and education. With our proxy, we find that even after accounting for the prevalence of teleworkable jobs, areas that are lower income, majority-minority, or majority lower-educated have experienced less of an increase in work from home than other areas. This suggests that factors beyond whether a worker is in a teleworkable occupation seem to influence whether a worker has experienced a greater increase in telework during the pandemic.
We construct a weekly work-from-home measure by combining SafeGraph daily anonymized cell phone geolocation data from January 2020 through February 2021 with the most recent population, employment, and occupation data from the U.S. Census Bureau’s American Community Survey (ACS), available at the block group level._ Block groups are statistical subdivisions of census tracts, generally defined to consist of 600 to 3,000 residents. For each census block group, we obtain a proxy for the number of cell phones that belong to individuals employed in teleworkable occupations and limit our device count to phones that remain at home for more than 18 hours per day._ We then aggregate this device count at the block group level to obtain a national proxy for the number of work-from-home devices. Chart 1 plots our weekly proxy, normalized to 1.0 on January 6, 2020, to facilitate comparisons. For example, any movement above or below 1.0 denotes an increase or decrease in work from home relative to the January 2020 baseline.
Chart 1: After an Initial Surge, Work from Home Declined but Remains above Pre-pandemic Levels
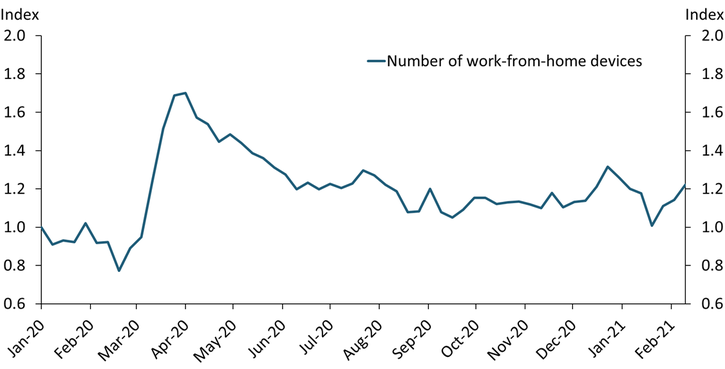
Note: The number of work-from-home devices is normalized to 1.0 on January 6, 2020.
Sources: SafeGraph, U.S. Census Bureau, Dingel and Neiman (2020), and authors’ calculations.
Our measure suggests that work from home has declined since the onset of the pandemic but remains elevated. When the pandemic hit and most U.S. states issued stay-at-home orders, the number of work-from-home devices (blue line) increased sharply. The measure peaked in early April and started to decline as states began to reopen. From late June onward, it has been relatively stable but remains above its pre-pandemic levels. To assess how our national measure compares with results from surveys, we convert our measure to monthly averages and compare it with monthly supplemental survey data from the Bureau of Labor Statistics (BLS) on shares of employed individuals who teleworked, which are only available since May 2020. The correlation between our measure and the BLS survey data is above 93 percent.
Although Chart 1 is helpful in assessing the trends in work from home over time, the patterns across communities may differ. To evaluate this possibility, we characterize census block groups based on population-weighted quintiles for median household income using the ACS data. We define low-income communities as those in the first and second quintiles, middle-income communities as those in the third quintile, and high-income communities as those in the fourth and fifth quintiles. Chart 2 shows that before the pandemic, the three groups had seen little or no change in work-from-home behavior. When the pandemic hit, all three groups saw dramatic increases in work from home, but the increase was much higher for high-income block groups (blue line) than others (green and orange lines). Work from home across all groups began to decline in April 2020 and stayed relatively stable from late June onward; however, as of late February 2021, the differences between income groups remained._
Chart 2: Higher-Income Communities Experienced a Greater Increase in Work from Home than Low-Income Communities following the Start of the Pandemic
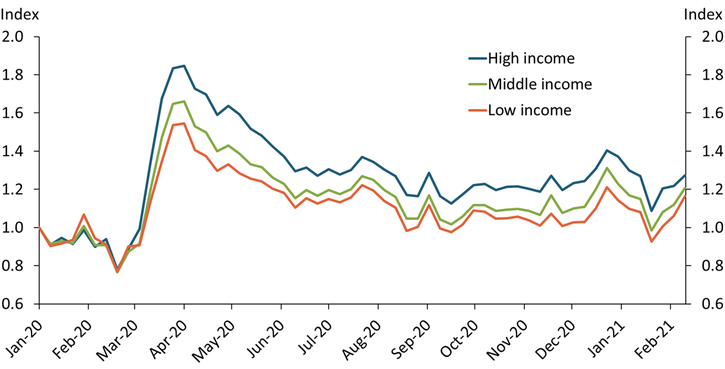
Note: The number of work-from-home devices is normalized to 1.0 on January 6, 2020.
Sources: SafeGraph, U.S. Census Bureau, Dingel and Neiman (2020), and authors’ calculations.
Changes in work-from-home patterns may also differ across communities with different racial compositions. To account for this possibility, we characterize census block groups as majority-minority if at least half the population is non-Hispanic Black or Hispanic and majority-nonminority otherwise, as in Chakrabarti and Nober (2020). Chart 3 shows that, similar to Chart 2, the two groups had little or no difference in work-from-home behavior before the pandemic. When the pandemic hit, however, work from home increased more in majority-nonminority block groups (blue line) than in others (green line). Although the gap between changes experienced by the two groups began to close in late April 2020 when states started to reopen, it re-emerged in July and widened in the following months. By February 2021, work from home in majority-minority communities had largely returned to pre-pandemic levels, while work from home in majority-nonminority communities remained well above pre-pandemic levels.
Chart 3: Majority-Nonminority Communities Experienced a Greater Increase in Work from Home than Others during Most of the Pandemic
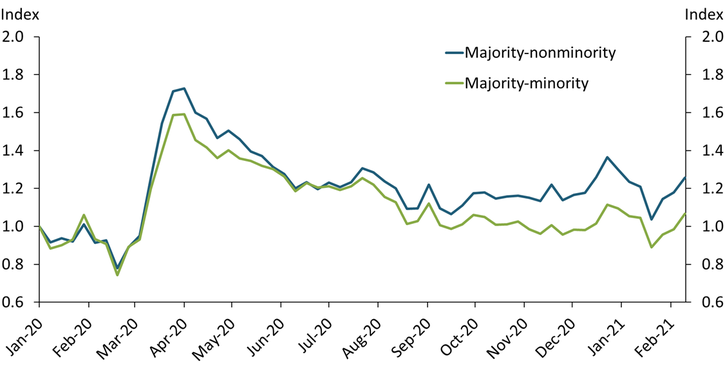
Note: The number of work-from-home devices is normalized to 1.0 on January 6, 2020.
Sources: SafeGraph, U.S. Census Bureau, Dingel and Neiman (2020), and authors’ calculations.
Finally, we explore changes in work-from-home behavior across different education groups. We characterize census block groups as majority higher-educated if at least half of the population age 25 years and over has a bachelor’s degree or higher, and majority lower-educated otherwise. Chart 4 shows that differing changes in majority higher-educated (blue line) and majority lower-educated (green line) block groups’ work-from-home behavior also only showed up when the pandemic hit, with majority higher-educated block groups experiencing a persistently higher increase in work from home than others over the course of the pandemic.
Chart 4: Majority Higher-Educated Communities Experienced a Greater Increase in Work from Home than Others following the Start of the Pandemic
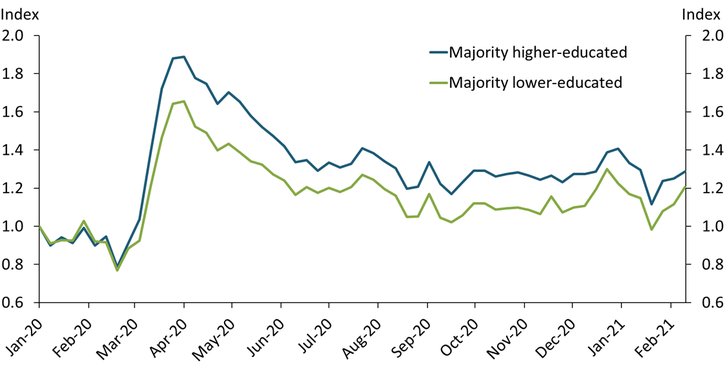
Note: The number of work-from-home devices is normalized to 1.0 on January 6, 2020.
Sources: SafeGraph, U.S. Census Bureau, Dingel and Neiman (2020), and authors’ calculations.
Overall, our high-frequency measure of work from home suggests that after an initial surge when the pandemic hit, work from home declined by mid-summer 2020, but remained above pre-pandemic levels almost a year after the onset of the pandemic. In addition, our measure reveals important, persistent differences in changes in work-from-home behavior by income, race, and education. Specifically, high-income, majority-nonminority, and majority higher-educated communities experienced greater increases in work from home than others over the course of the pandemic. Our results suggest that, beyond whether or not a worker is in a teleworkable occupation, factors such as income, race, and level of education may play a role in whether a worker has experienced a greater increase in telework during the pandemic._
Endnotes
-
1
We use data at the block group level from the 2015–19 waves of the ACS, which are only available in the five-year estimates.
-
2
For each block group, we multiply the number of devices that stayed at home more than 18 hours per day by the share of working age (15–64) individuals in the block group’s population and the share of the employed who are in a teleworkable occupation. Population, occupation, and employment data come from the ACS, and our teleworkable occupation classification is based on Dingel and Neiman (2020). When we consider an alternative, more conservative measure—for each block group, we multiply the number of devices that stayed at home more than 18 hours per day by the share of teleworkable employment in block group population—we get very similar results.
-
3
One may think that our device-based measure might capture people leaving or losing their jobs and staying at home rather than working from home. However, low-wage employment declined considerably more than high-wage employment, with persistent job losses for low-wage workers over the course of the pandemic. If job losses were a major factor driving our results, we might see a different pattern.
-
4
Overall, our results are consistent with studies highlighting the characteristics of individuals who can work from home or those who cannot: see, for example, Mongey, Pilossoph, and Weinberg (2020) and Bartik and others (2020).
References
Bartik, Alexander, Zoe Cullen, Edward L. Glaeser, Michael Luca, and Christopher Stanton. 2020. “External LinkWhat Jobs Are Being Done at Home during the COVID-19 Crisis? Evidence from Firm-Level Surveys.” National Bureau of Economic Research, working paper no. 27422, June.
Chakrabarti, Rajashri, and William Nober. 2020. “External LinkDistribution of COVID-19 Incidence by Geography, Race, and Income.” Federal Reserve Bank of New York, Liberty Street Economics blog, June 15.
Dingel, Jonathan I., and Brent Neiman. 2020. “External LinkHow Many Jobs Can Be Done at Home?” Journal of Public Economics, vol. 189, September.
Mongey, Simon, Laura Pilossoph, and Alex Weinberg. 2020. “External LinkWhich Workers Bear the Burden of Social Distancing Policies?” National Bureau of Economic Research, working paper no. 27085, May.
Nida Çakır Melek is a senior economist at the Federal Reserve Bank of Kansas City. Sungil Kim is a research associate at the bank. The views expressed are those of the authors and do not necessarily reflect the positions of the Federal Reserve Bank of Kansas City or the Federal Reserve System.