Commercial Real Estate Activity in the Tenth District Stabilized at Low Level

PDFDownload Article

The Federal Reserve Bank of Kansas City released its KC Fed CRE Index for the second quarter of 2024 today. After declining for several consecutive quarters, the value of the index rose slightly from -1.3 to -0.85, indicating commercial real estate activity in the region stabilized during the first part of the year, albeit at a low level.

“Many aspects of commercial real estate activity across the region stopped declining in recent months, but the recent pick up in vacancy rates kept downward pressure on rents. Though the downward slide in CRE conditions seemed to slow through March, few signs of improvement emerged during the first part of the year,” according to Nicholas Sly, vice president at the Federal Reserve Bank of Kansas City.

Chart 1: The KC Fed CRE Index stabilized, but activity was below historical norms

Chart 1 shows the values of the KC Fed CRE Index over time. The value of the index drops precipitously during the 2007–08 global financial crisis. The value of the index begins to rise in 2009 but does not normalize for several years, consistent with the slow recovery following a period of financial instability. The value of the index remains elevated through the longest expansion on record for the U.S. economy, before collapsing in 2020 at the onset of the COVID-19 pandemic. The index recovers much more quickly from the pandemic than from the financial crisis but indicates signs of stress in recent quarters. The index increased slightly during the most recent quarter but remains below historical norms.

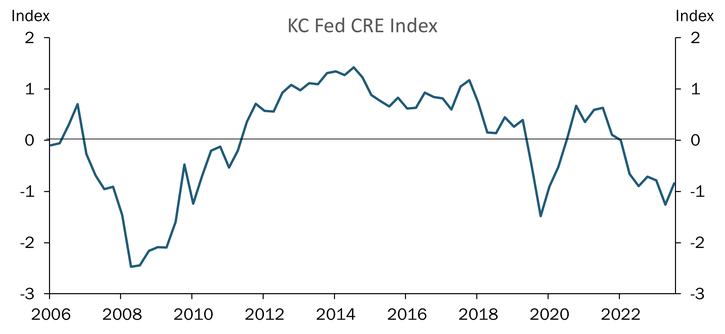
Note: An index value of zero corresponds to overall conditions being at their historical average and differences from zero are measured in terms of standard deviations from the historical norm.

Table 1: Primary drivers change in the current KC Fed CRE Index

Table 1 lists all the variables that comprise the CRE index accompanied by their standardized contributions to the change in the index. The variables with the largest contributions to the change in the index are construction materials inventories and credit standards for CRE loans.

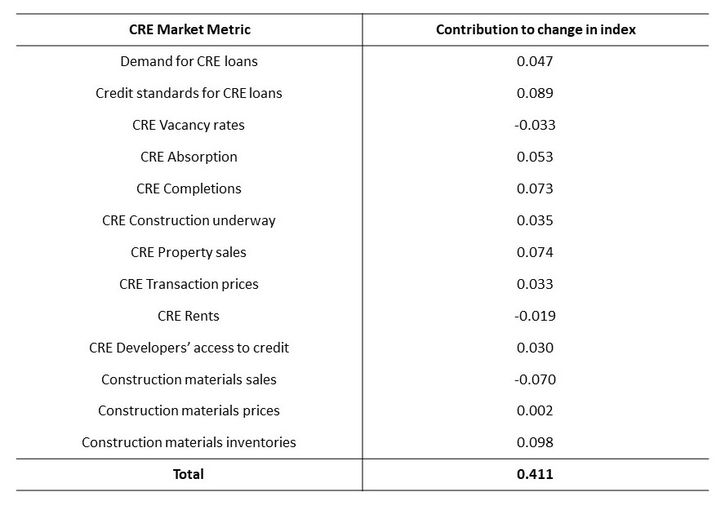
Notes: Contributions may not add to total change in index due to rounding. The contribution of each metric is calculated as the change in the standardized value of the variable from the previous quarter multiplied by the coefficient of the variable in the index.

Chart 2: Contacts agreed more on their recent reports of market conditions, improving signal quality of the KC CRE Index

Chart 2 shows the change in the Shannon entropy of the CRE index respondents over time. The measure is inverted to show that higher levels of Shannon entropy indicate lower signal quality. Shannon entropy declined during the first half of the recovery period between 2010 and 2015 and began to rise again between 2015 and 2019. Shannon entropy has been at an elevated level for the past few years. Entropy declined in the most recent quarter, indicating improved signal quality.

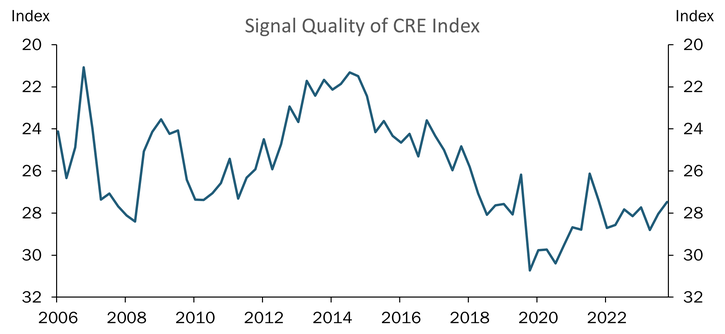
Note: Values correspond to measures of Shannon entropy, with higher numerical values indicating more mixed responses and lower signal quality of the KC Fed CRE Index.

PDFCurrent Release

Excel SpreadsheetCurrent Data

About the KC Fed CRE Index

Authors

Nicholas Sly

Vice President, Economist, and Denver Branch Executive

Nicholas Sly is Vice President and Denver Branch Executive at the Federal Reserve Bank of Kansas City. In this role, he serves as the Bank’s regional economist and its representa…

Bethany Greene

Research Associate II

Bethany Greene is a Regional Affairs Research Associate at the Denver Branch of the Federal Reserve Bank of Kansas City. In her role, she provides research support for a number o…