Further strengthening in the U.S. agricultural economy bolstered farm credit conditions in the first quarter. According to Federal Reserve surveys of agricultural credit conditions, farm loan repayment rates continued to improve at a rapid pace. Following multiple years of weakness and growing financial stress, bankers reported that farm income was higher than a year ago for the second consecutive quarter and demand for farm loans was subdued. Interest rates on farm loans remained at historic lows, and along with better financial conditions; supported widespread increases in farmland values.

Strength in markets for most major agricultural commodities has led to higher prices and expanded profit opportunities across the sector in recent months. Together with robust financial support from government aid programs related to the pandemic, conditions have led to a rapid improvement in farm finances. While prospects for the cattle industry have strengthened less substantially and drought continued to stress producers in many areas of the country, the overall outlook for farm income and credit conditions remained significantly improved from recent years.

First Quarter Federal Reserve District Ag Credit Surveys

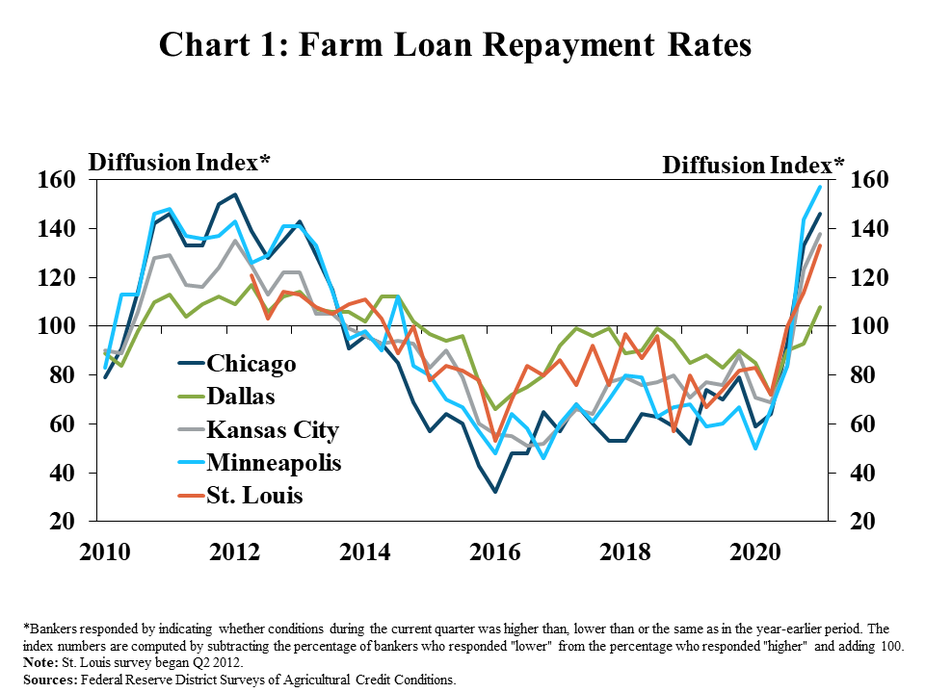
Farm loan repayment rates increased rapidly across the bulk of farm country in the first quarter. In aggregate, survey respondents reported an increase in the rate of loan repayment for the second consecutive quarter in most regions (Chart 1). Repayment rates improved for the first time since 2014 in the Dallas District, and were higher across all areas in the same quarter for the first time since 2013.

1.	Chart 1: Farm Loan Repayment Rates, is a line graph showing the diffusion index of farm loan repayment rates in each quarter for the Chicago, Dallas, Kansas City, Minneapolis and St. Louis Districts from 2010 to 2021. The index is on a 100 scale, with 100 representing no change, values above 100 representing an increase from the same time a year ago and values below 100 representing a decrease from a year ago.   *Bankers responded by indicating whether conditions during the current quarter was higher than, lower than or the same as in the year-earlier period. The index numbers are computed by subtracting the percentage of bankers who responded "lower" from the percentage who responded "higher" and adding 100. Note: St. Louis survey began Q2 2012.  Sources: Federal Reserve District Surveys of Agricultural Credit Conditions.

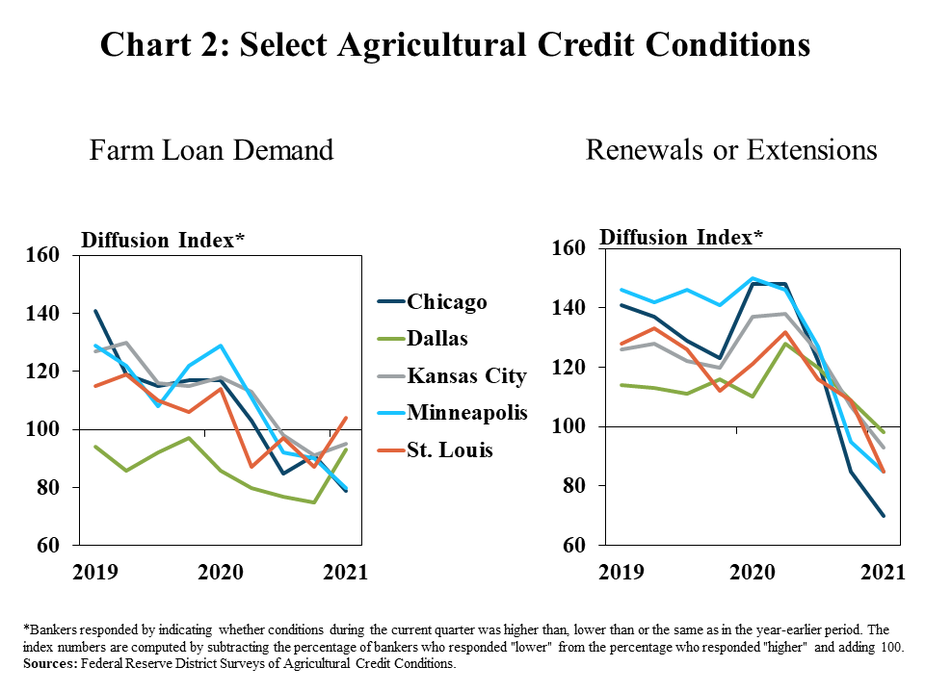
Demand for farm loans remained dampened while renewal and extension activity dropped considerably in some areas. Farm loan demand declined at a modest pace in all Districts except St. Louis and instances of renewals or extensions were lower than a year ago across all regions (Chart 2). Demand for loans dropped at a slightly faster pace in the Chicago and Minneapolis Districts than others.

2.	Chart 2: Select Agricultural Credit Conditions, includes two individual charts. Left, Farm Loan Demand is a line graph showing the diffusion index of farm loan demand in each quarter for the Chicago, Dallas, Kansas City, Minneapolis and St. Louis Districts from 2019 to 2021. The index is on a 100 scale, with 100 representing no change, values above 100 representing an increase from the same time a year ago and values below 100 representing a decrease from a year ago. Right, Renewals or Extensions, is a line graph showing the diffusion index of renewals or extensions in each quarter for the Chicago, Dallas, Kansas City, Minneapolis and St. Louis Districts from 2019 to 2021.  *Bankers responded by indicating whether conditions during the current quarter was higher than, lower than or the same as in the year-earlier period. The index numbers are computed by subtracting the percentage of bankers who responded "lower" from the percentage who responded "higher" and adding 100. Sources: Federal Reserve District Surveys of Agricultural Credit Conditions.

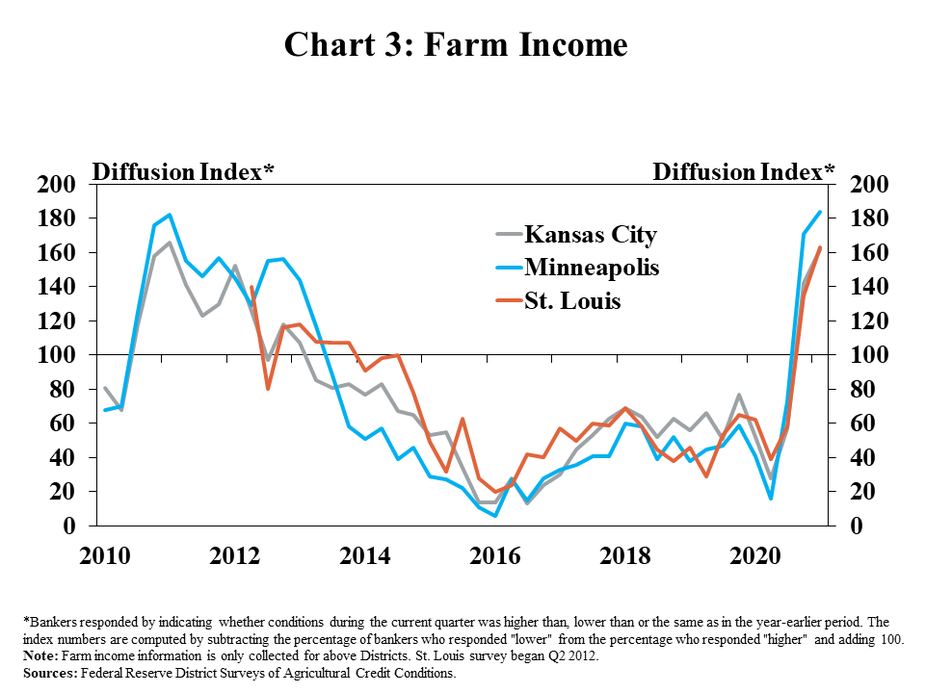
Contributing to the improvement in credit conditions, farm income also strengthened rapidly. Respondents across all participating Districts reported higher incomes than a year ago for the second consecutive quarter (Chart 3). Following multiple years of steady deterioration, around 70% of all participating bankers reported that farm income was higher than a year ago.

3.	Chart 3: Farm Income, is a line graph showing the diffusion index of farm income in each quarter for the Kansas City, Minneapolis and St. Louis Districts from 2010 to 2021. The index is on a 100 scale, with 100 representing no change, values above 100 representing an increase from the same time a year ago and values below 100 representing a decrease from a year ago.  *Bankers responded by indicating whether conditions during the current quarter was higher than, lower than or the same as in the year-earlier period. The index numbers are computed by subtracting the percentage of bankers who responded "lower" from the percentage who responded "higher" and adding 100. Note: Farm income information is only collected for above Districts. St. Louis survey began Q2 2012. Sources: Federal Reserve District Surveys of Agricultural Credit Conditions.

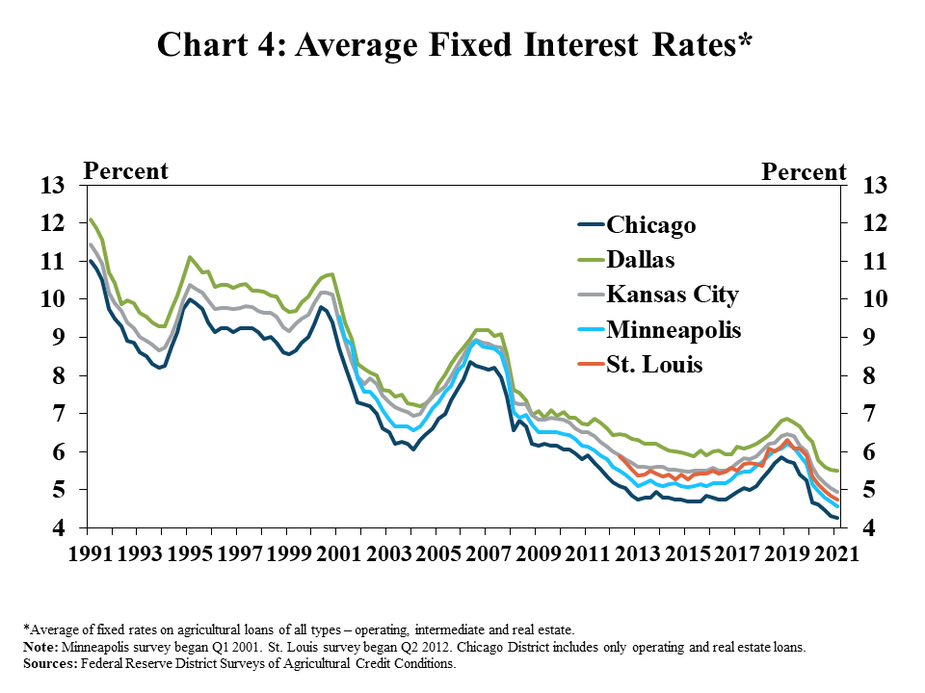
Average interest rates on farm loans remained at historic lows. The average fixed rate on all types of agricultural loans was at least 40 basis points less than a year ago and at least 170 basis points less than the 20-year average across all Districts in the first quarter (Chart 4). The average rate charged for financing agricultural production remained comparably higher in the Dallas District and lower in the Chicago District.

4.	Chart 4: Average Fixed Interest Rates*, is a line graph showing the average fixed rate on all types of agricultural loans as a percent in each quarter for the Chicago, Dallas, Kansas City, Minneapolis and St. Louis Districts from 2010 to 2021.   *Average of fixed rates on agricultural loans of all types – operating, intermediate and real estate. Note: Minneapolis survey began Q1 2001. St. Louis survey began Q2 2012. Chicago District includes only operating and real estate loans.  Sources: Federal Reserve District Surveys of Agricultural Credit Conditions.

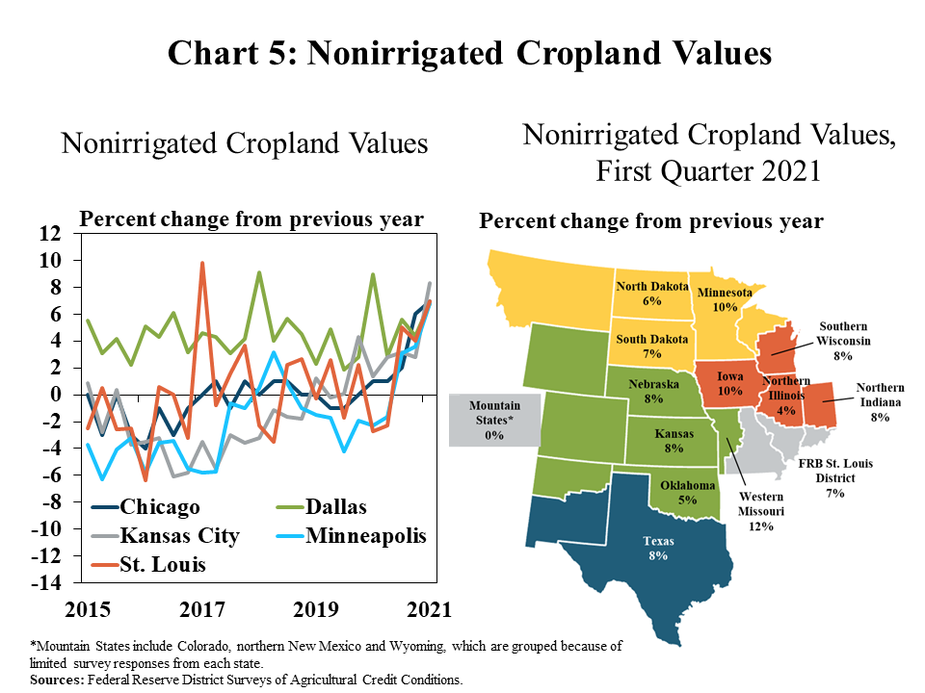
Strength in the farm economy and low interest rates also supported farm real estate values in all regions during the first quarter. The value of nonirrigated cropland increased by 7% on average across all Districts (Chart 5). The gains in real estate values were also consistent throughout most states, with the exception of the Mountain States, where exceptional and intensifying drought has led External Linkto a less substantial improvement in financial conditions.

5.	Chart 5: Nonirrigated Cropland Values, includes a chart and a map. Left, Nonirrigated Cropland Values is a line graph showing the percent change in nonirrigated cropland values from the previous in each quarter for the Chicago, Dallas, Kansas City, Minneapolis and St. Louis Districts from 2015 to 2021. Right, Nonirrigated Cropland Values, First Quarter 2021, is a map showing the percent change in nonirrigated cropland values from the previous in Q1 2021 for the following individual states from north to south: North Dakota, Minnesota, South Dakota, Southern Wisconsin, Nebraska, Iowa, Northern Illinois, Norther Indiana, Mountain States*, Kansas, Western Missouri, FRB St. Louis District, Oklahoma and Texas.   *Mountain States include Colorado, northern New Mexico and Wyoming, which are grouped because of limited survey responses from each state. Sources: Federal Reserve District Surveys of Agricultural Credit Conditions

Data and Information

Excel SpreadsheetHistorical Data

Excel SpreadsheetTables

txtAbout the Federal Reserve Ag Credit Survey

Authors

Nate Kauffman

Senior Vice President, Economist, and Omaha Branch Executive

Nate Kauffman is Senior Vice President and Omaha Branch Executive at the Federal Reserve Bank of Kansas City. In his role as the Kansas City Fed's lead economist and represe…

Ty Kreitman

Associate Economist

Ty Kreitman is an associate economist in the Regional Affairs Department at the Omaha Branch of the Federal Reserve Bank of Kansas City. In this role, he primarily supports the F…