Farm debt at commercial banks grew at a steady pace through the end of 2023 while loan delinquencies remained historically low. Alongside strong growth in non-real estate lending, total farm debt at commercial banks increased just short of 5% over the past year. Non-real estate debt climbed at an increasingly swift pace throughout 2023 and ended the year near the 20-year average. Farm real estate debt remained well above historic averages, but growth slowed notably.
Demand for agricultural production loans picked up from many lenders in 2023 alongside a moderation in agricultural commodity prices that thinned profits and increased financing needs. However, a sizeable portion of lenders also continued to report subdued farm loan demand as many borrowers remained flush with cash after several years of considerable strength in farm incomes.
The financial strength of recent years also bolstered loan performance and helped keep loan delinquencies at historically low levels. Looking ahead - the farm economy is expected to soften further in 2024, which will be a risk to farm finances and agricultural credit conditions and could put additional upward pressure on loan demand.
Fourth Quarter Commercial Bank Call Report Data
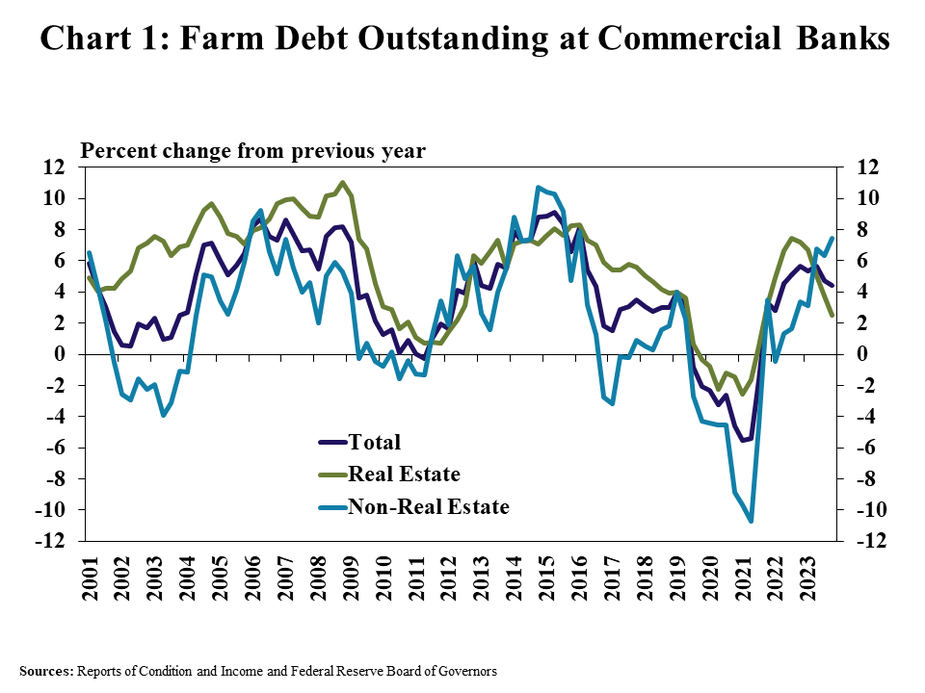
Growth in agricultural production loans strengthened through the end of the year, while growth in real estate debt continued to soften. Non-real estate farm debt was up more than 7% from the same time a year ago, continuing over a year of strong growth (Chart 1). Growth in farm real estate debt, however, continued to slow through the end of the year, increasing by less than 3% from the previous year.
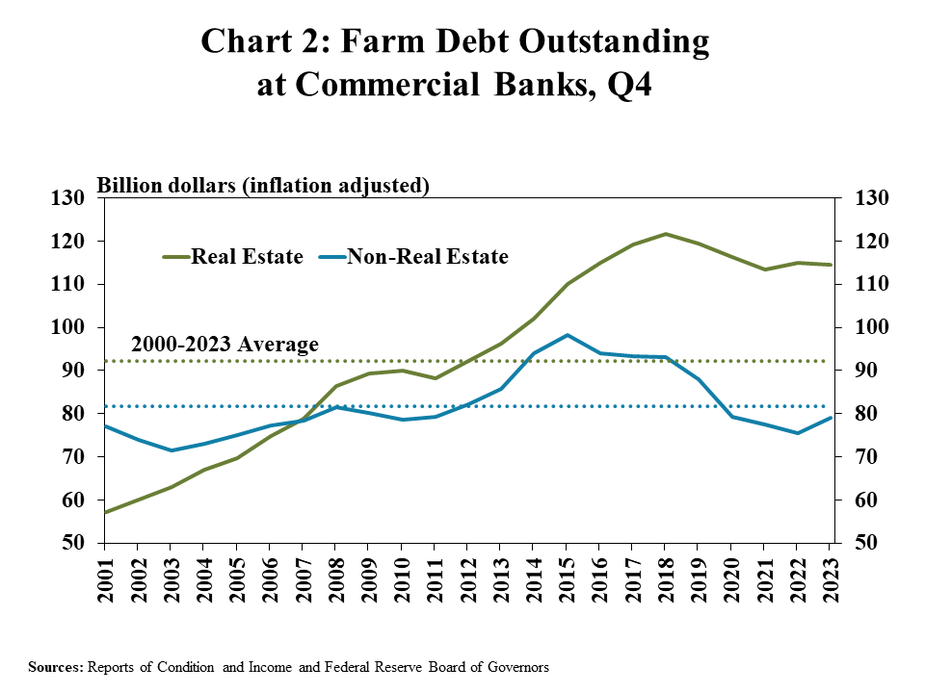
Real estate debt remained elevated despite more tempered growth and non-real estate debt rebounded closer to average levels. After adjusting for inflation, farm real estate debt retracted from a record high in 2018 but was still 25% above the recent historical average through the end of 2023 (Chart 2). Non-real estate debt grew from relatively low levels a year ago and neared its longer-term average.
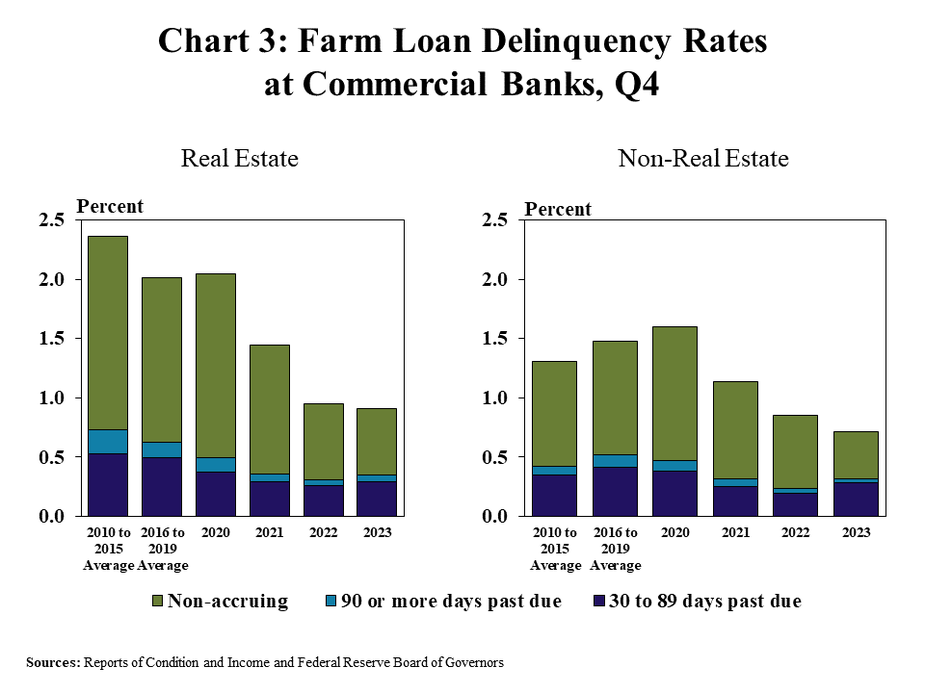
Despite steady growth in debt throughout the year and a moderation in farm income, loan performance remained strong. The rate of delinquency on both real estate and non-real estate farm loans fell slightly in 2023 and remained at historic lows (Chart 3). Longer-term delinquency rates drove the gradual improvement, but the share of loans past due less than 90 days increased slightly.
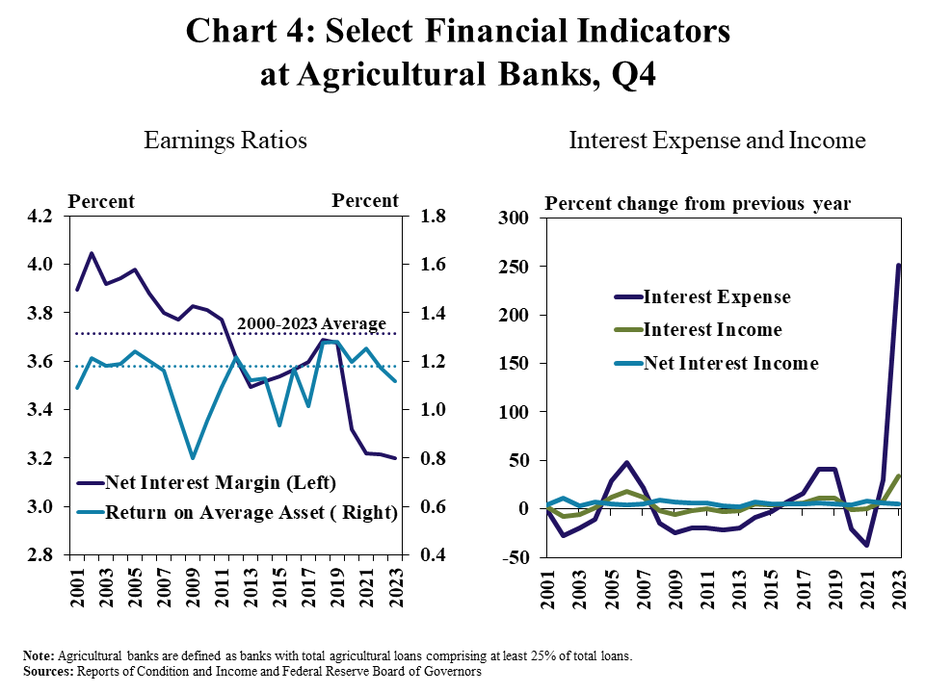
While credit quality was solid, profits for agricultural banks were tempered by slim net interest margins. The return on average assets for agricultural banks decreased from last year and ended 2023 slightly below the average return since 2000 (Chart 4, left panel). Profits softened as the net interest margin remained subdued alongside a rapid growth in funding costs that has outpaced growth in interest income (Chart 4, right panel).
Data and Information
Excel SpreadsheetCommercial Bank Call Report Historical Data
Excel SpreadsheetCommercial Bank Call Report Data Tables
txtAbout the Commercial Bank Call Report Data
The views expressed are those of the authors and do not necessarily reflect the positions of the Federal Reserve Bank of Kansas City or the Federal Reserve System.