Farm debt at commercial banks showed signs of stabilizing at the end of 2021. Driven by a higher balance of both real estate and non-real estate loans, agricultural debt increased for the first time since 2019. While the pullback in lending abated, agricultural loan balances remained below the recent historic average. Farm real estate loans also increased slightly at agricultural banks, but production loans continued to decline and led to further reduction in the concentration of debt among those lenders. The low interest rate environment continued to pressure margins for lenders and sharp asset growth pushed capital ratios lower, but recent strength in earnings performance held overall returns for agricultural banks above the recent historic average.
A relatively strong outlook for the farm economy in 2022 appears likely to continue supporting improvements in agricultural credit conditions. Alongside broad strength in farm finances, delinquency rates on farm loans improved further through the end of the year and liquidity at agricultural banks reached a 20-year high. A rise in production expenses and a reduction in government aid could contribute to higher demand for farm loans in the year ahead and with abundant liquidity, agricultural banks seem to be well positioned to meet borrowers’ credit needs.
Fourth Quarter Commercial Bank Call Report Data
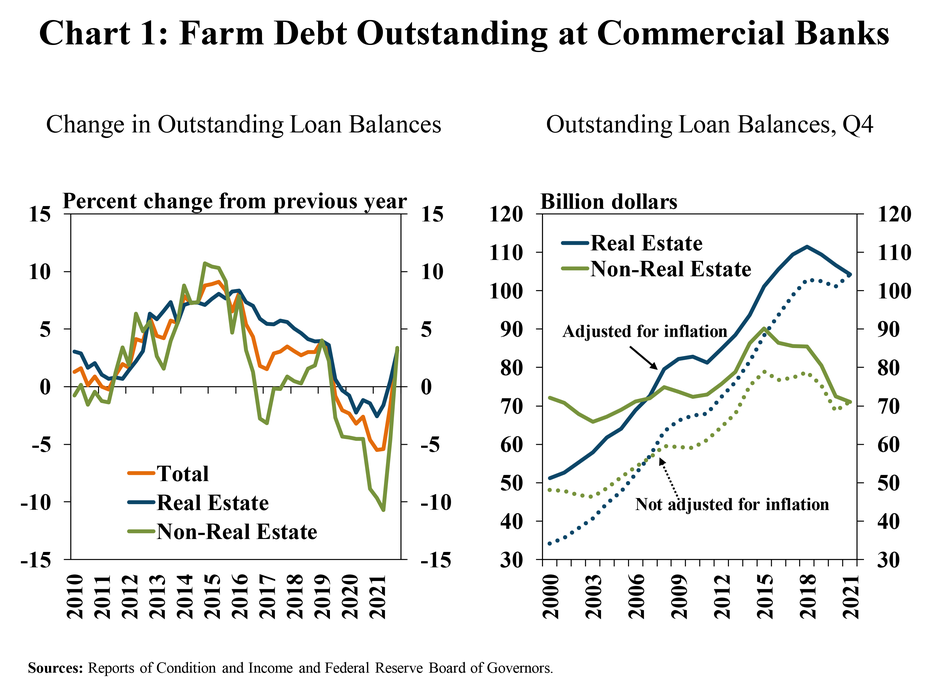
The balance of outstanding farm loans at commercial banks increased from a year ago, but remained subdued. Following about two years of steady declines, the balance of both real estate and non-real estate farm loans increased about 3% in the fourth quarter (Chart 1, left panel). Despite the slight increase from a year ago, non-real estate loans remained at a decade low after adjusting for inflation and real estate loans remained at about a 5-year low (Chart 1, right panel).
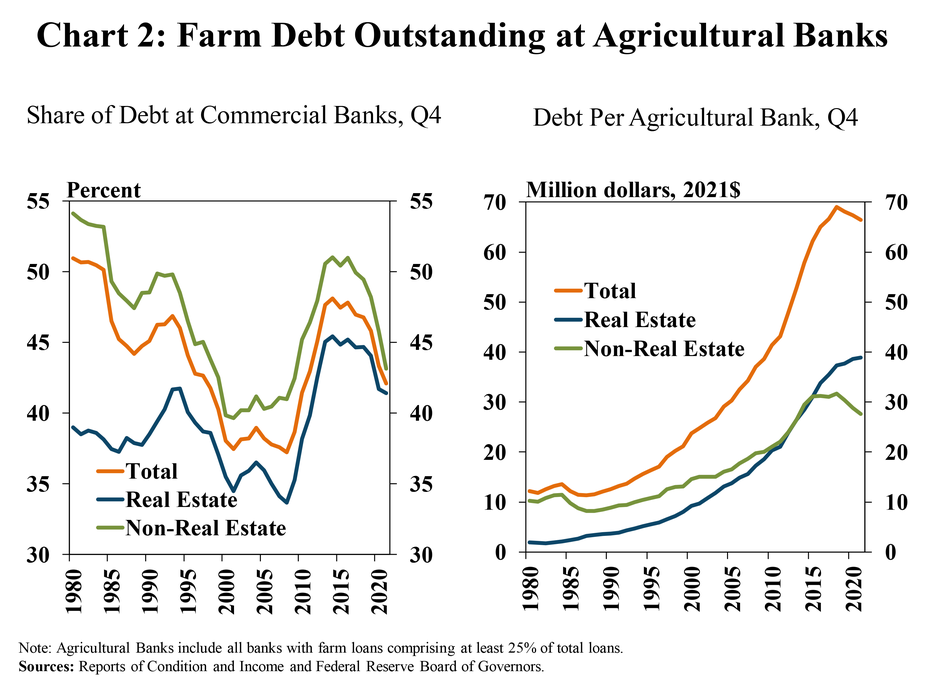
Consistent and widespread declines in agricultural lending across commercial banks has led to lower concentrations of farm debt at agricultural banks. Farm real estate loan balances increased slightly at agricultural banks, but production loans continued to decline, pushing the share of farm debt held at lenders most concentrated in agriculture to the lowest level in about 10 years (Chart 2, left panel). After a sharp and persistent buildup in previous years, the recent pullback in non-real estate lending has also driven a reduction in the amount of farm debt per agricultural bank (Chart 2, right panel).
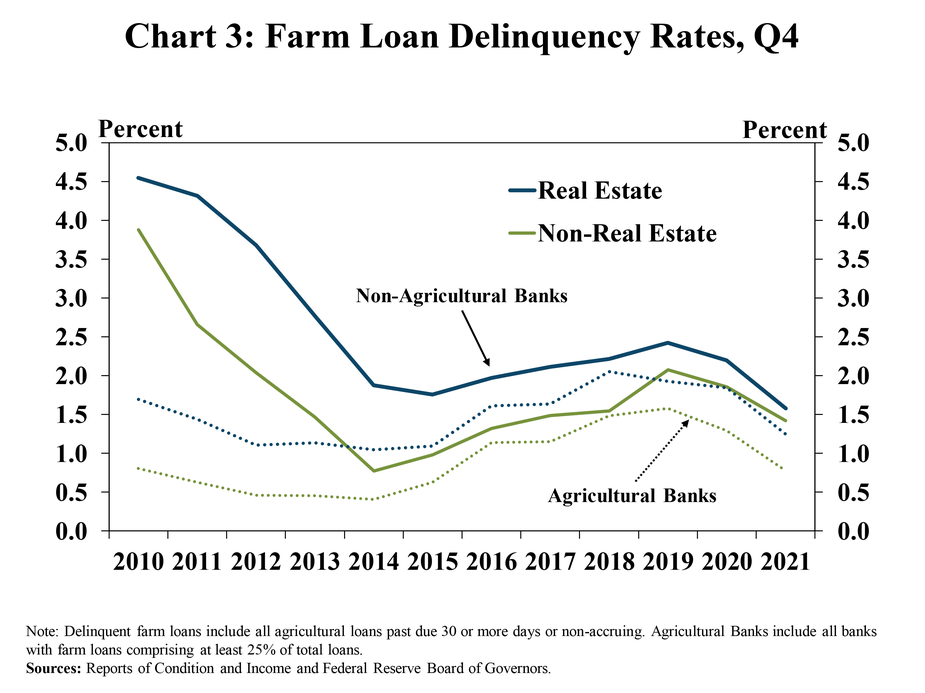
Broad strength in farm finances continued to drive improvements in agricultural loan performance for all commercial lenders. Delinquency rates on real estate and non-real estate farm loans dropped by about 60 basis points and 50 basis points from a year ago, respectively (Chart 3). Rates of delinquency among both agricultural banks and non-agricultural banks reached the lowest levels since 2015.
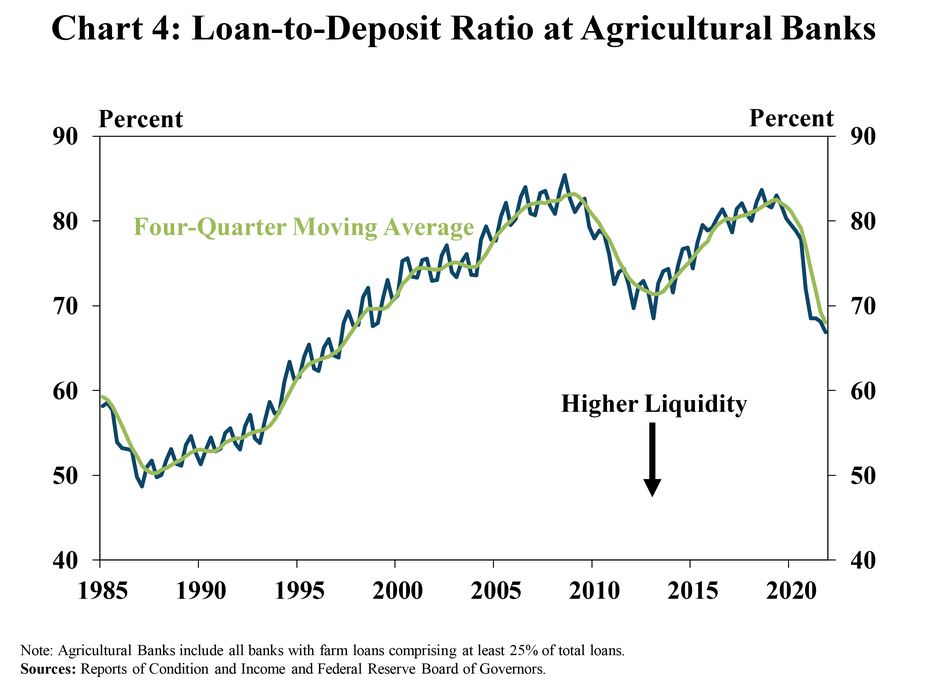
With tepid loan growth and surges in deposits, liquidity at agricultural banks also remained abundant. The loan-to-deposit ratio at agricultural lenders reached the lowest level in more than 20 years in the fourth quarter (Chart 4). The elevated level of funds has contributed to a sharp growth in assets for lenders and has also likely put downward pressure on interest margins.
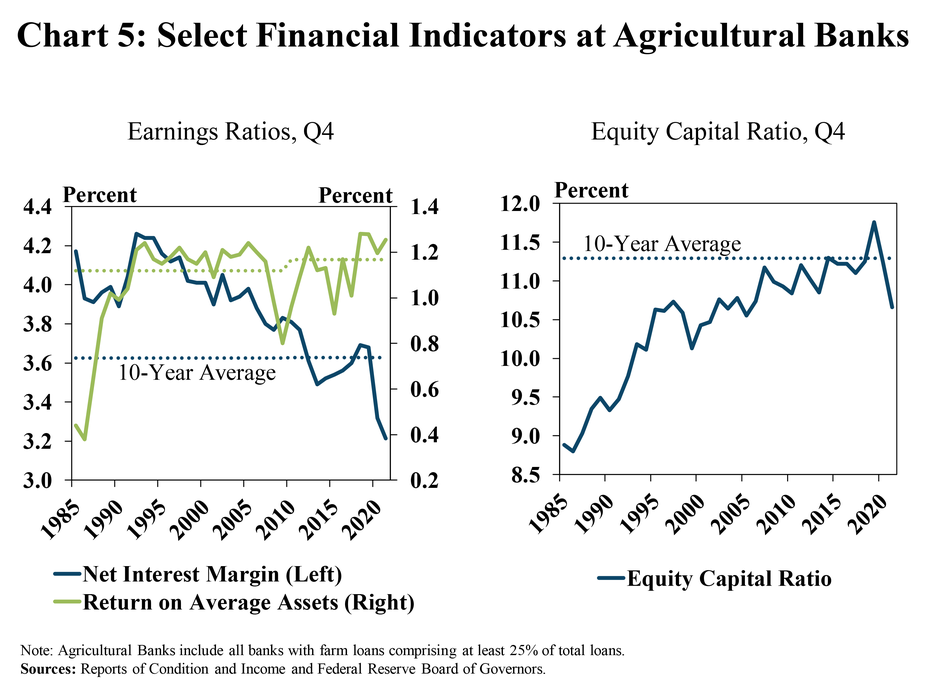
Net interest margins for agricultural banks reached historic lows in the fourth quarter, but profits remained strong. The low interest rate environment put further downward pressure on margins, but support from lower interest expenses, fewer provisions and higher noninterest income during 2021 continued to drive strong returns (Chart 5, left panel). Alongside robust growth in assets that was consistent across commercial banks, the equity capital ratio for farm lenders dropped sharply below the 10-year average (Chart 5, right panel).
Data and Information
Excel SpreadsheetCommercial Bank Call Report Historical Data
Excel SpreadsheetCommercial Bank Call Report Data Tables
txtAbout the Commercial Bank Call Report Data
The views expressed in this article are those of the authors and do not necessarily reflect the views of the Federal Reserve Bank of Kansas City or the Federal Reserve System.