Following several years of sluggish population growth prior to the COVID-19 pandemic, Oklahoma experienced a surge of in-migration from other states in recent years, including in 2023. This edition of Oklahoma Economist examines multiple sources of state migration data to quantify the drivers of the state’s population growth. It finds the recent surge of new residents was driven primarily by historic levels of domestic migration from states in the western half of the U.S., as well as a reversal of the “brain drain” that plagued the state for much of the 2010s.
Oklahoma continues to see heightened levels of domestic migration post-pandemic
Oklahoma’s population grew by 0.85% in 2023, the fastest rate since 2013. This follows two consecutive years of 0.7% growth in 2021 and 2022 (Chart 1). Population growth is affected by three things: natural population growth (births minus deaths), net international migration (from other countries), and net domestic migration (from other states). A previous External LinkOklahoma Economist noted that the accelerated growth in 2021 was largely due to historic levels of domestic in-migration to Oklahoma, even as the natural increase turned negative for the first time on record in the wake of COVID-19. The subsequent two years showed a continuation of the trend of historic levels of in-migration, including 27,000 new residents from other U.S. states in 2022 and 23,000 in 2023. Meanwhile, natural population growth finally rebounded in 2023, and international immigration reached its highest level since 2015 at a net gain of nearly 8,400 residents.
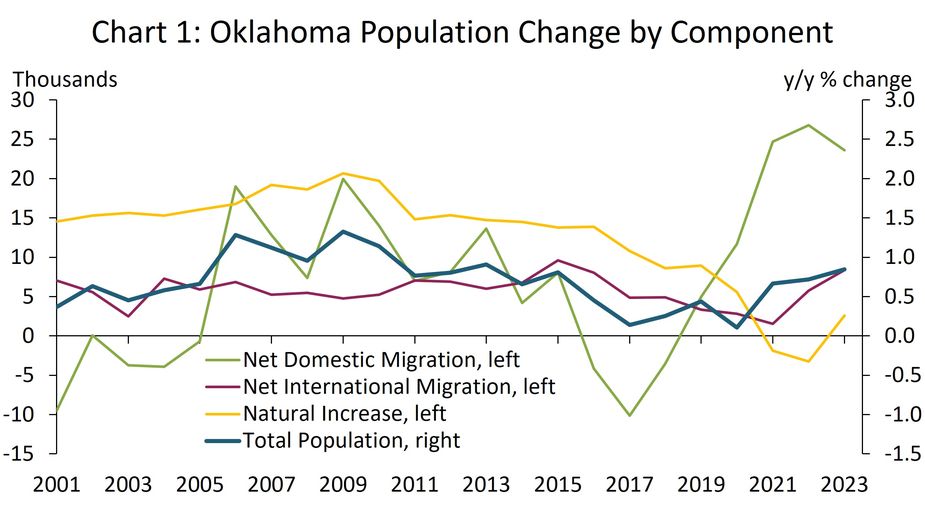
Source: U.S. Census Bureau
Looking across states, Oklahoma had the 12th highest level of net domestic migration in the country both in 2023 and cumulatively from 2020 to 2023, with a net increase equivalent to 1.9% of its population (Map 1, Panel A). Idaho, South Carolina, and Montana had the highest relative domestic in-migration, while New York, California, and Illinois had the highest relative out-migration throughout the pandemic and its recovery.
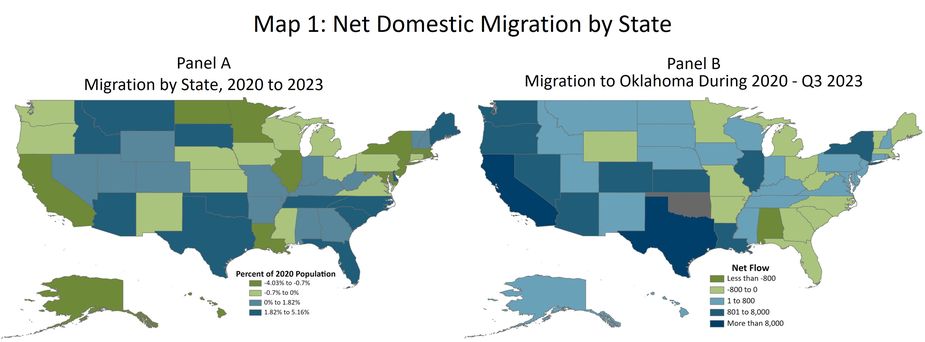
Notes: Categories shown in Panel A are quartiles, with the 50th Percentile slightly altered to be 0. Migration to Oklahoma (Panel B) is limited to age 25+.
Source: U.S. Census Bureau, FRBNY Consumer Credit Panel/Equifax, authors’ calculations
Almost all of Oklahoma’s in-migration was from western and Great Plains states
Several data sources examine state migration trends. The most widely followed are the U.S. Census Population and Housing Unit Estimates, which track national and state population change and its components from July 1 of the previous year to July 1 of the current year and are released with a six-month lag._ The New York Fed’s Consumer Credit Panel (CCP) data sourced from Equifax can also estimate migration trends nationwide in quarterly intervals with just a one-month lag, and identify the state from which residents move._ The overall migration trends from CCP generally track the Census estimates, especially when measured as the migration from Q3 of the previous year to Q3 of the current year to match the Census time frame._
Based on the most recent CCP data, Oklahoma had a net gain of residents from 29 states over the past year (from Q3 2022 to Q3 2023). The state gained the most residents, by far, from California and Texas. An estimated 3,960 more Californians and 2,600 more Texans moved to Oklahoma from Q3 2022 to Q3 2023 than moved from Oklahoma to those states, with Arizona ranking third with a net gain of 1,120 individuals. By contrast, a net 440 Oklahomans left the state for Arkansas and a net 320 moved to South Carolina over the past year. These migration patterns are basically a continuation of post-pandemic trends. Since 2020, Oklahoma saw a net gain of residents from 34 states, with California and Texas leading at 12,700 and 8,880 people, respectively (Map 1, Panel B). In the same period, a net 3,360 individuals from Colorado and 2,200 from Arizona relocated to Oklahoma.
Oklahoma’s domestic population gains over the past five years were almost completely driven by migration from states in and west of the Great Plains, i.e., states west of Oklahoma’s eastern border. Migration to Oklahoma from both eastern and western states was mostly equal from around 2009 to 2017 (Chart 2). But starting in 2018, in-migration from the west began to increase while net migration from the east stayed near zero. The pandemic magnified this trend, bringing nearly 49,000 new residents from the western U.S. to the state, and over 15,000 in 2022 alone. While a significant portion of this migration was from California and Texas, Oklahoma gained residents from other western states as well. At peak domestic migration in 2022, a net 5,560 people moved from California and 3,780 moved from Texas, but 6,120 individuals also moved in from all other western states. In fact, Oklahoma gained residents on net from every western and Great Plains state from 2020 to Q3 2023, except for Wyoming which gained a net 100 Oklahomans in that time.
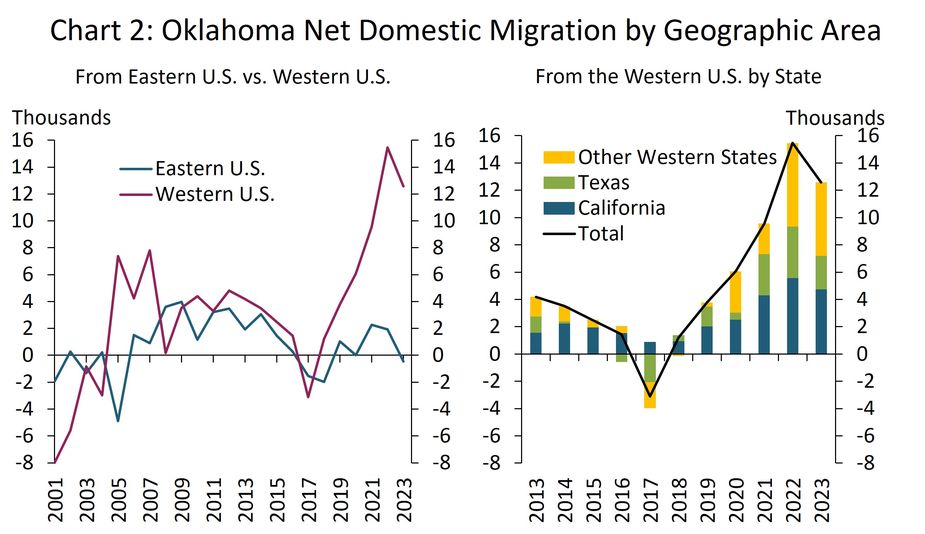
Notes: Migration is measured as the migration during Q3 of the previous year to Q3 of the current year. The sample is limited to age 25+.
Source: FRBNY Consumer Credit Panel/Equifax, authors’ calculations
The state has had “brain gain” since the pandemic, but has not yet made up for previous losses
Not only has Oklahoma gained more residents on net since the pandemic, but also has gained more residents with bachelor’s or advanced degrees than it lost, reversing a worrisome trend from the 2010s. Detailed data from the Census Bureau’s American Community Survey (ACS) reveal the state experienced brain gain each year since 2020.__ Oklahoma has consistently gained new residents without bachelor degrees since 2000 with only few exceptions, but the migration of those with bachelor’s degrees has been mixed (Chart 3). Net migration among bachelor’s degree holders generally hovered near zero from 2000 to 2012. Then, 2012 began a period of sustained “brain drain,” with the state losing around 5,000 people with undergraduate degrees per year until the pandemic. By 2019, Oklahoma had lost nearly 29,000 college graduates. This loss stopped during the pandemic. In 2020, the state gained just a few more college graduates than it lost and had “brain gain” for the first time since 2011. Oklahoma then gained about 6,000 college graduates in 2021 and over 4,000 in 2022 but has still cumulatively lost more than 18,000 since 2000.
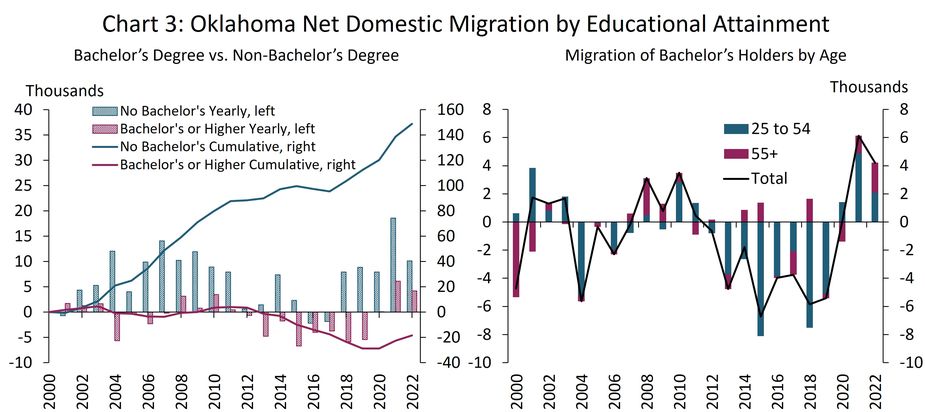
Notes: The sample is limited to those age 25+ who reported educational attainment. Cumulative change is relative to 2000.
Source: ACS 1-year estimates/IPUMS USA, University of Minnesota, www.ipums.org, authors’ calculations
Breaking down this trend by age shows the state also gained more prime-age college graduates than it lost in recent years. This is significant because the vast majority of graduates who left the state in the 2010s were prime-age—between the ages of 25 to 54—and the few net graduates the state gained were over the age of 55 (Chart 3). In 2020, Oklahoma saw net zero migration of all individuals with bachelor's degrees but gained 1,400 prime-age college graduates and lost nearly as many older graduates. In 2021, around 4,900 of the 6,100 college graduates gained were prime-age, and about half of them were in 2022.
Although the state’s brain gain has reached historic levels, Oklahoma is only near the median in terms of relative net domestic migration of bachelor’s degree holders, with the 21st highest level cumulatively during 2020 through 2022 (Map 2, Panel A). Most of the states in the top quartile are close in proximity to California or New York, two states with very large urban areas that experienced record levels of out-migration during the pandemic. Other top states are popular coastal destinations like the Carolinas and Florida. Many Midwestern states lost college-educated residents on net. Oklahoma and many other states in the region are in the second quartile.
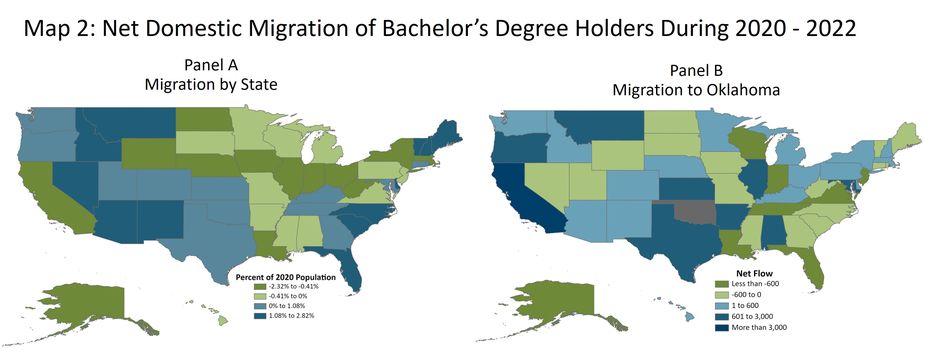
Notes: Sample is limited to age 25+. Categories shown in Panel A are quartiles, with the 50th Percentile slightly altered to be 0.
Sources: ACS 1-year estimates/IPUMS USA, University of Minnesota, www.ipums.org, Haver Analytics, authors’ calculations
Like the overall migration trends, the influx of college graduates to Oklahoma came from the western half of the United States. Oklahoma posted a slight net loss of college graduates to states east of Oklahoma from 2020 to 2022. However, over 4,000 college-educated Californians on net moved to Oklahoma after the pandemic, and around 2,200 moved from Oregon (Map 2, Panel B). The state also gained nearly 2,000 college graduates from Texas in the same period, reversing a longstanding trend of brain drain to the Lone Star state.
Summary and Conclusions
In 2023, Oklahoma had its largest population gain this decade, which continues to be driven by elevated domestic migration post-pandemic. Most of these new Oklahomans moved from the western half of the United States and do not have bachelor’s degrees. Despite this, Oklahoma experienced brain gain for the first time in a decade, but not yet enough to make up for previous losses. Domestic migration to the state slowed slightly in 2023, but is still very high relative to historical averages. It remains to be seen if this trend will continue with the pandemic largely in the rearview mirror, and how it will affect the state’s economy.
Endnotes
-
1
External Linkhttps://www.census.gov/data/tables/time-series/demo/popest/2020s-state-total.html
-
2
The CCP constitutes a 5% representative sample of the nation comprised of anonymized credit reports containing millions of observations. Thus, it can undercount migration of lower income individuals without access to credit. It also naturally excludes people under the age of 18 and undercounts individuals under 25 relative to the Census Bureau’s estimates, as they are less likely to have opened lines of credit. However, we limit the sample to individuals aged 25 and older to eliminate college students’ migration in or out of Oklahoma solely for their studies. This restriction is especially relevant when looking at net migration from Texas, given the External Linkgrowing number of Texans attending the University of Oklahoma and Oklahoma State University. More information about the CCP can be found in the External LinkNew York Fed’s introductory paper to the CCP (Lee & van der Klaauw 2010).
-
3
See chart linked below for comparison of data sources. Some disparities between sources can likely be attributed to the restrictive sample of prime-age individuals with a credit report for the CCP and the different time period for the ACS data, as explained in endnotes 2 and 5.
-
4
The University of Minnesota releases ACS data on the observational level as part of its External LinkIntegrated Public Use Microdata Series (IPUMS) with a one-year lag, which allows for in-depth analysis of the demographic and economic characteristics of the individuals who migrated to and from Oklahoma.
-
5
Migration in the ACS is measured by asking respondents throughout the calendar year where they lived one year ago and comparing it to their current state of residence. So, the migration captured each year can range anywhere from January of the previous year to December of the current year. Thus, these estimates can differ from the Census Bureau’s Population and Housing Unit Estimates benchmarked to July. By plotting the ACS estimates one year ahead of the Census population estimates as shown above, the time overlap between the estimates for a given year is from July to December of the previous year. This sample is also restricted to individuals aged 25 and older to exclude migration among college students.