Balances on new small business commercial and industrial (C&I) loans in the fourth quarter of 2020 declined 20.1 percent from the third quarter, due primarily to a decrease in new term lending following the end of Paycheck Protection Program (PPP) originations in August. Outstanding small business C&I balances increased about 70 percent from the fourth quarter of 2019, driven by existing PPP loan balances. The percent of outstanding small business C&I loans secured by Small Business Administration (SBA) guarantees declined in the fourth quarter, reflecting no new PPP loan originations and increased amounts of PPP loan forgiveness. For the second consecutive quarter, survey respondents noting a change, on net, reported weakening loan demand and tightening credit standards and loan terms.
Chart 1: Small Business C&I Loan Balances Increase 70 Percent Year-Over-Year
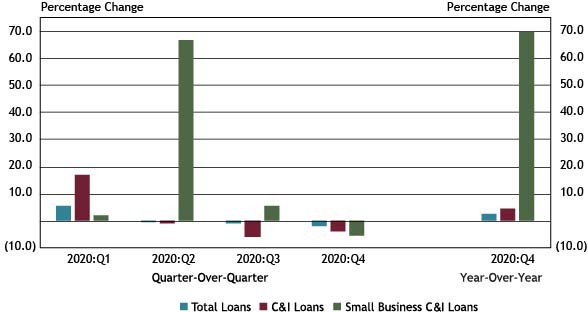
Note: Items are calculated using a subset of 86 respondents that completed the FR 2028D for the last five quarters surveyed.
Sources: Call Report, schedule RC-C Part I, items 4. Commercial and Industrial Loans and 12. Total loans and leases held for investment and held for sale; and FR 2028D, items 4.b and 5.c.
Small business C&I loan balances increased 69.7 percent year-over-year, bolstered by outstanding loans guaranteed by the SBA through the PPP, the third consecutive quarter of year-over-year increases of nearly 70 percent. Total loans and C&I loans increased by 2.3 percent and 4.8 percent, respectively, when compared with the same period.
Despite a large year-over-year increase, small business C&I loans declined by 5.6 percent quarter-over-quarter. This was primarily driven by the expiration of the PPP and an increase in loan forgiveness payments and paydowns in the fourth quarter. Total loan balances and C&I loan balances declined 1.7 percent and 4.0 percent, respectively.
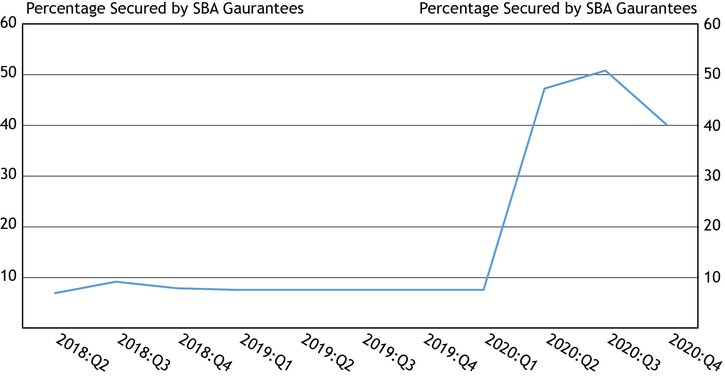
Chart 2: Outstanding Loan Balances Secured by SBA Guarantees Decline
Source: FR 2028D, Special Question
The percentage of outstanding small business C&I loan balances secured by the SBA declined from 51 percent in the third quarter to 40 percent in the fourth quarter. This decline can be attributed primarily to the SBA’s PPP loan forgiveness, which increased in the fourth quarter, along with small businesses paying down outstanding PPP loans. Additionally, no new PPP loans were originated in the fourth quarter following the close of the lending program in August 2020. Prior to the second quarter of 2020, the percent of balances secured by the SBA had ranged from 7 to 9 percent.
Chart 3: New Small Business C&I Loan Balances Decline Quarter-Over-Quarter and Year-Over-Year
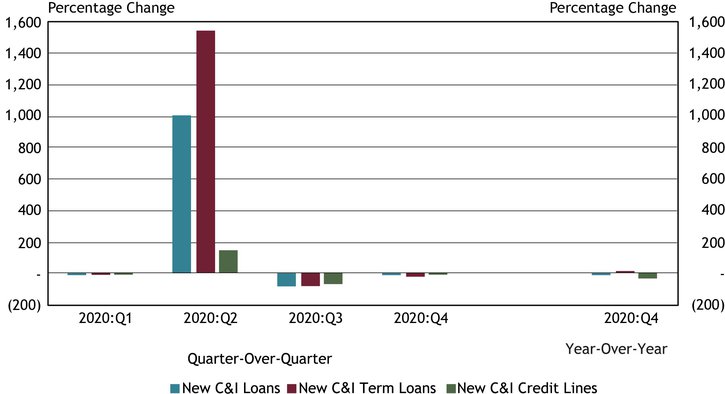
Note: Items are calculated using a subset of 86 respondents that completed the FR 2028D for the last five quarters surveyed. All loan types referenced in Chart 3 refer to small business lending.
Source: FR 2028D, items 7.b and 8.c
Balances on new small business C&I loans declined in the fourth quarter. When compared to the pre-pandemic fourth quarter of 2019, new small business C&I lending declined by 14.2 percent, driven by a drop of 36.3 percent in new small business C&I credit line balances. New small business C&I loan balances declined 20.1 percent quarter-over-quarter, reflecting the expiration of the PPP program.
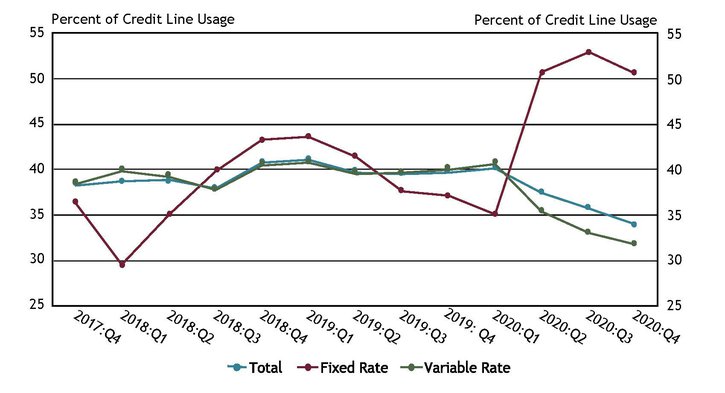
Chart 4: Fixed and Variable Rate Credit Line Usage Declines
Source: FR 2028D, items 5.b and 5.c.
Total small business C&I credit line usage declined for the third consecutive quarter from 40.1 percent in the first quarter to 34.0 percent in the fourth quarter. Similarly, the use of variable rate small business C&I credit lines declined from 40.7 percent in the first quarter to 31.7 percent in the fourth quarter. Fixed rate small business C&I credit line usage declined for the first time since the first quarter of 2020, declining from 52.9 percent in the third quarter to 50.5 percent in the fourth quarter.
Chart 5: Interest Rates Remain Relatively Stable across Most New Loan Categories
Note: Items are calculated using a subset of 86 respondents that completed the FR 2028D for the last five quarters surveyed.
Source: FR 2028D, items 7.c and 8.d
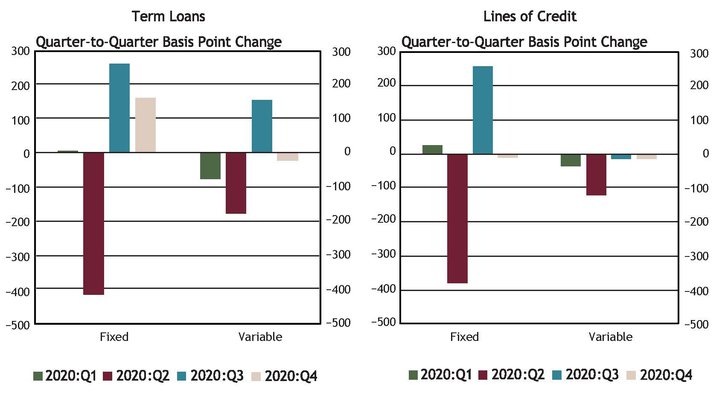
Weighted average rates on new fixed and variable rate lines of credit and variable rate term loans changed little in the fourth quarter. The increase of 161 basis points in fixed rates for new term loans can be attributed, in part, to banks originating no new PPP loans at 1.0 percent with the August close of the SBA program.
Chart 6: Interest Rates on Fixed Rate New Term Loans Higher than All Other Term Loan Rates
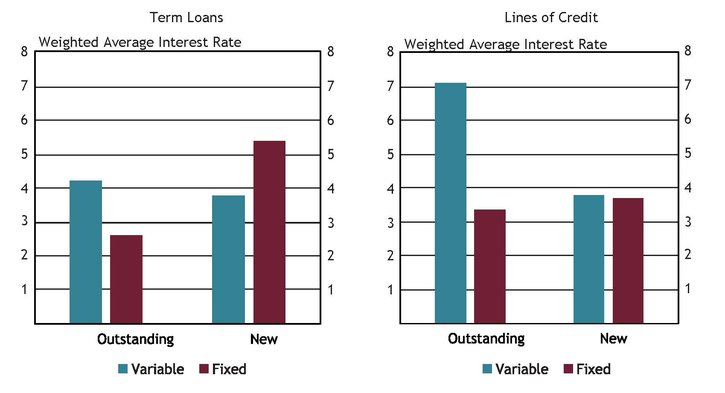
Note: Average interest rates are weighted by the dollar volume of new small business C&I loans.
Source: FR 2028D, items 4.c, 5.d, 7.c and 8.d
The weighted average rates for fixed rate new small business C&I term loans were higher than the weighted average rates for all other term loans, primarily due to banks originating no PPP loans after the SBA program closed in August. Weighted average variable rates on outstanding lines of credit were the highest, at 7.13 percent, while weighted average rates on outstanding fixed rate term loans were the lowest at 2.60 percent.
Chart 7: Percent of New Loans with Interest Rate Floor and 3-Month U.S. Treasury Rate Remain Relatively Stable
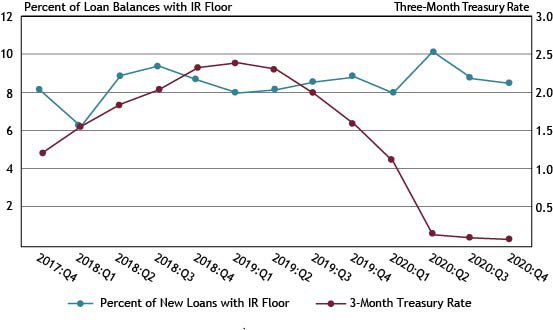
Source: FR 2028D, items 7.a, 7.f, 8.a and 8.e, Federal Reserve Bank of St. Louis, 3-Month Treasury Constant Maturity Rate
The percent of new small business C&I loans with interest rate floors and the 3-Month U.S. Treasury Rate remained relatively stable in the fourth quarter, with the percentage of new loans with interest rate floors declining slightly to 8.5 percent and the 3-Month U.S. Treasury Rate declining slightly to 0.09 percent.
Chart 8: Respondents Report Mixed Credit Line Usage
Notes: Chart 8 shows diffusion indexes for credit line usage. The diffusion indexes show the difference between the percent of banks reporting decreased credit line usage and those reporting increased credit line usage. Net percent refers to the percent of banks that reported having decreased (“decreased somewhat” or “decreased substantially”) minus the percent of banks that reported having increased (“increased somewhat” or “increased substantially”). (See footnote 1.)
Source: FR 2028D, items 11 and 12.
The percentage of respondents indicating a change in credit line usage, whether an increase or decrease, declined from 44 percent in the third quarter to 36 percent in the fourth quarter. Responses were split nearly evenly between increases and decreases. Of banks reporting a change in credit line usage, 62 percent cited change in local or national economic conditions, and 56 percent cited change in a borrower’s business revenue or other business specific conditions as very important reasons for a change._
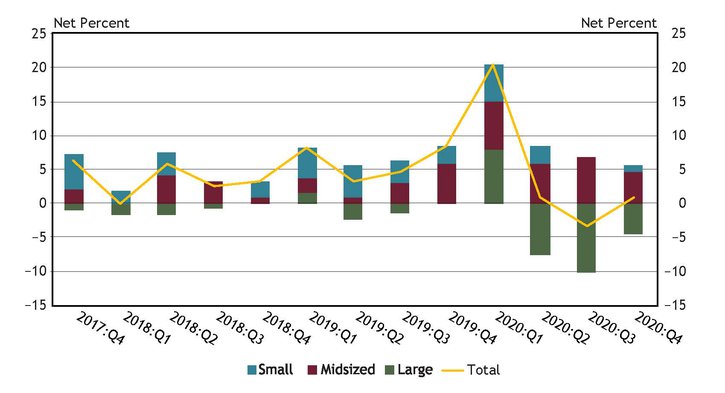
Chart 9: Respondents Report Weaker Loan Demand
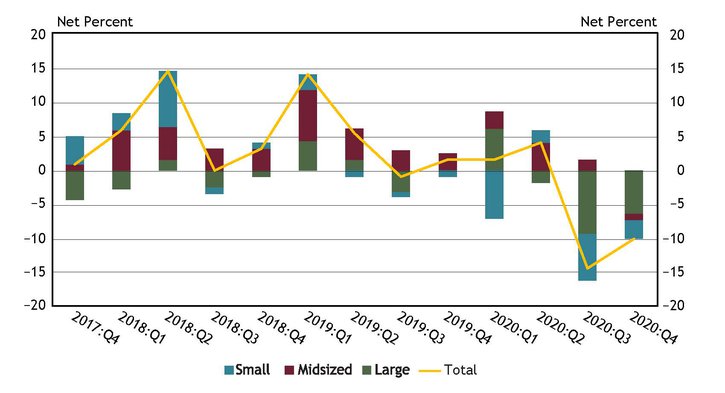
Notes: Chart 9 shows diffusion indexes for loan demand. The diffusion indexes show the difference between the percent of banks reporting weakened loan demand and those reporting stronger loan demand. Net percent refers to the percent of banks that reported having weakened (“moderately weaker” or “substantially weaker”) minus the percent of banks that reported having stronger loan demand (“moderately stronger” or “substantially stronger”).
Source: FR 2028D, item 13.
In the fourth quarter, about 43 percent of banks reported a change in loan demand. On net, about 6 percent of large banks indicated weaker loan demand, compared with about 3 percent of small banks and 1 percent of midsized banks. This is the first time since the start of the survey in which all three bank sizes reported a net decrease in loan demand.
Chart 10: Application Approval Rates Rebound for Large Banks
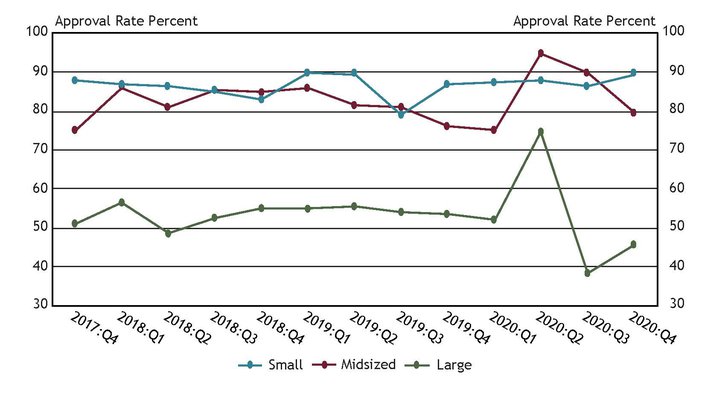
Source: FR 2028D, items 14.a and 15
Application approval rates for large banks rebounded from their lowest levels since the start of the survey, increasing from 38 percent in the third quarter to 46 percent in the fourth quarter. Application approval rates for small banks also increased over the same period, from 87 percent to 90 percent. In contrast, application approval rates for midsized banks declined, from 90 percent in the third quarter to 80 percent in the fourth quarter. The three most commonly cited reasons for denying a loan were borrower financials, collateral and credit history.
Chart 11: Decreases Reported in Credit Quality across All Bank Sizes
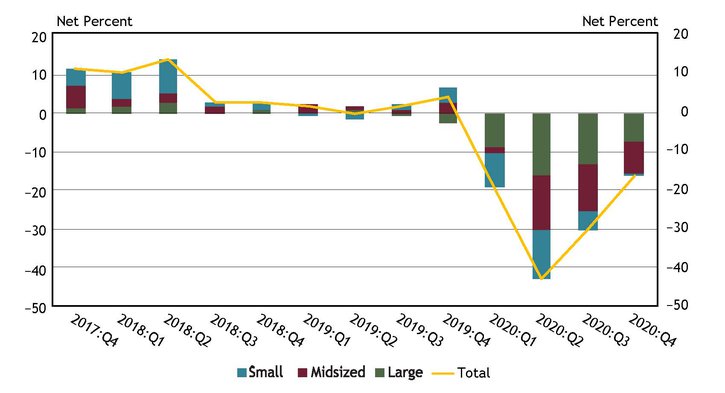
Notes: Chart 11 shows diffusion indexes for credit quality of applicants. The diffusion indexes show the difference between the percent of banks reporting a decline in credit quality and those reporting improvement in credit quality. Net percent refers to the percent of banks that reported declining credit quality (“declined somewhat” or “declined substantially”) minus the percent of banks that reported improving credit quality (“improved somewhat” or “improved substantially”).
Source: FR 2028D, items 20 and 21
In the fourth quarter, about 17 percent of banks, on net, reported a decline in the credit quality of applicants. While this is the fourth consecutive period in which respondents of all bank sizes, on net, reported declining credit quality, there were fewer banks, on net, reporting a decline. Of the respondents reporting a change in credit quality, whether an increase or decrease, 57 percent cited the liquidity position of business borrowers as a very important reason for a change. Other commonly cited reasons for a change include debt-to-income level of business owners and recent business income growth.
Chart 12: Banks Tighten Credit Standards and All Loan Terms
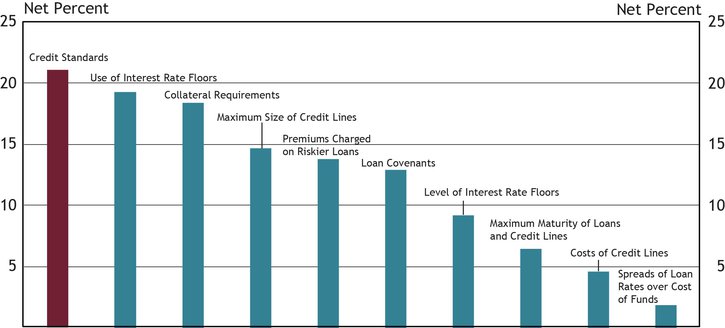
Note: Chart 12 shows diffusion indexes for credit standards (red bar) and various loan terms. The diffusion indexes show the difference between the percent of banks reporting tightening terms and those reporting easing terms. Net percent refers to the percent of banks that reported having tightened (“tightened somewhat” or “tightened considerably”) minus the percent of banks that reported having eased (“eased somewhat” or “eased considerably”).
Source: FR 2028D, items 16, 17, 18 and 19
About 23 percent of respondents reported a change in credit standards in the fourth quarter, down about 11 percent from the third quarter. Of banks indicating a change in credit standards, 21 percent on net reported tightening their credit standards (as shown in Chart 12), a decline of about 11 percent from the previous quarter.
On net, respondents indicated that all loan terms tightened, with use of interest rate floors and collateral requirements tightening the most. Respondents reporting tightening credit standards or loan terms in the fourth quarter cited a less favorable or more uncertain economic outlook, worsening industry specific problems, and increased concerns about the effects of legislatives changes, supervisory actions, or changes in accounting standards.
Other contributors to this release included Nicholas Bloom, Rosine Boni, Dan Harbour, Thomas Hobson and Tony Walker.
Endnotes
-
1
Small banks have total assets of $1 billion or less, midsized banks have total assets between $1 billion and $10 billion and large banks have total assets greater than $10 billion.