Summary of Quarterly Indicators
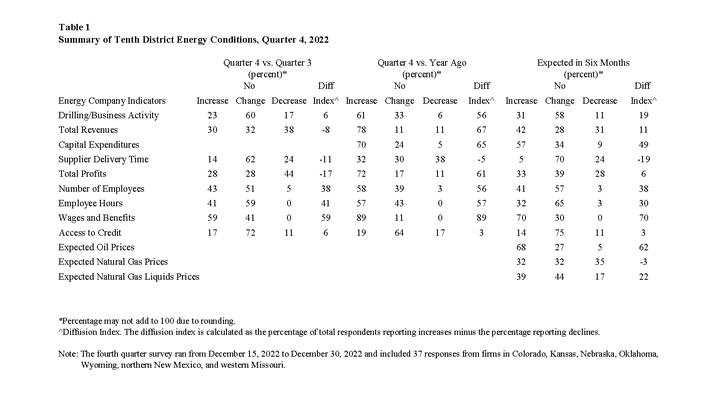
The pace of growth in Tenth District energy activity slowed in the fourth quarter of 2022, as indicated by firms contacted between December 15th, 2022, and December 30th, 2022 (Tables 1 & 2). The drilling and business activity index decreased from 44 to 6 (Chart 1). All other indexes decreased from previous readings, except the employee hours index that increased from 37 to 41.
Chart 1. Drilling/Business Activity Index vs. a Quarter Ago
Skip to data visualization table| Quarter | Vs. a Quarter Ago | Vs. a Year Ago |
|---|---|---|
| Q4 18 | -13 | 17 |
| Q1 19 | 0 | 17 |
| Q2 19 | 7 | -11 |
| Q3 19 | -23 | -21 |
| Q4 19 | -48 | -50 |
| Q1 20 | -81 | -92 |
| Q2 20 | -62 | -70 |
| Q3 20 | 4 | -71 |
| Q4 20 | 40 | -60 |
| Q1 21 | 35 | 12 |
| Q2 21 | 33 | 59 |
| Q3 21 | 43 | 68 |
| Q4 21 | 32 | 74 |
| Q1 22 | 29 | 52 |
| Q2 22 | 57 | 77 |
| Q3 22 | 44 | 78 |
| Q4 22 | 6 | 56 |
Year-over-year indexes remained mixed. The year-over-year indexes for employee hours and wages and benefits from 50 to 57 and 87 to 89, respectively. The index for wages and benefits maintained record-level highs (since September 2022). However, drilling/business activity, total revenues, total profits, and access to credit indexes decreased moderately. Expectations for future activity decreased slightly in Q4 2022 but remained positive. The future drilling and business activity index fell from 25 to 19, while expectations for future employee hours and wages and benefits increased slightly. Price expectations for oil decreased slightly, and expectations for natural gas prices also moderated further.
Summary of Special Questions
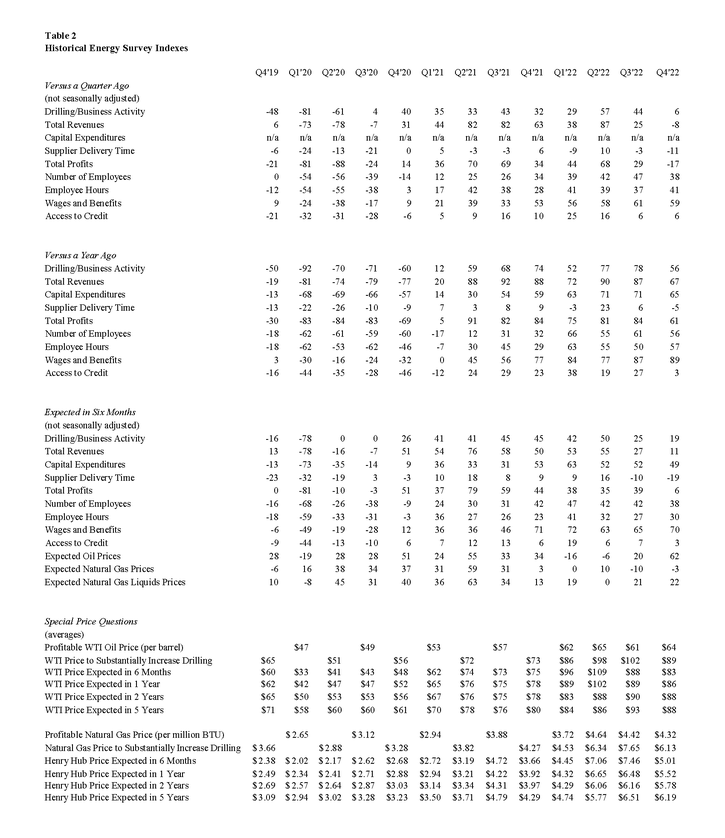
Firms were asked what oil and natural gas prices were needed on average for drilling to be profitable across the fields in which they are active. The average oil price needed was $64 per barrel, while the average natural gas price needed was $4.32 per million Btu (Chart 2). Firms were also asked what prices were needed for a substantial increase in drilling to occur across the fields in which they are active. The average oil price needed was $89 per barrel, and the average natural gas price needed was $6.13 per million Btu, (Chart 3).
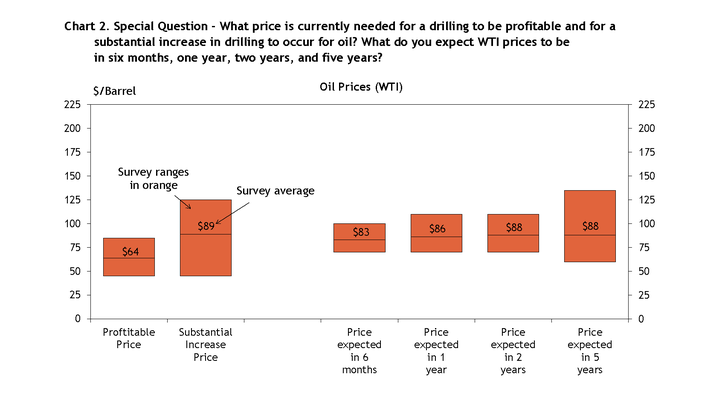
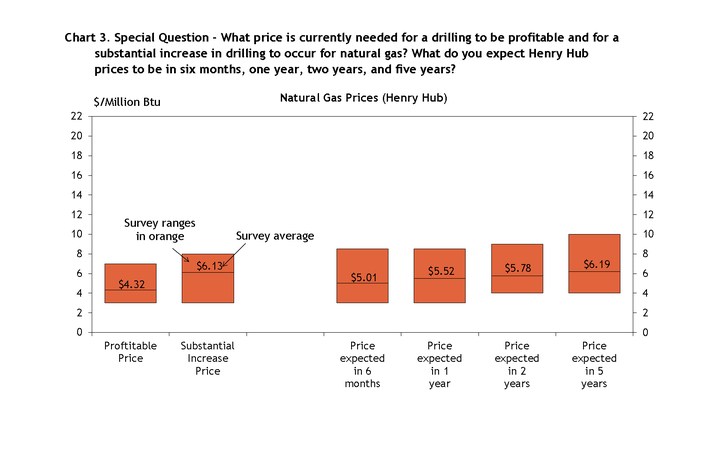
Firms reported what they expected oil and natural gas prices to be in six months, one year, two years, and five years. The average expected WTI prices were $83, $86, $88, and $88 per barrel, respectively. The average expected Henry Hub natural gas prices were $5.01, $5.52, $5.78, and $6.19 per million Btu, respectively. Energy firms were also asked by how much they expect prices for their firm’s key inputs to change from December 2022 to December 2023 (Chart 4). More than 70% of firms reported they expected prices to increase, 19% reported they expected to remain close to December 2022 levels, and 8% expected a decrease.
Chart 4. Special Question - By how much do you expect prices for your firm's key inputs to change from December 2022 to December 2023?
Skip to data visualization table| Response | Percent |
|---|---|
| Increase significantly | 5.6 |
| Increase slightly | 66.7 |
| Remain close to December 2022 levels | 19.4 |
| Decrease slightly | 5.6 |
| Decrease significantly | 2.8 |
In addition, firms were asked what the biggest drag on crude oil and natural gas production growth for their firm is (Chart 5). Nearly 40% of firms reported cost inflation and/or supply chain bottlenecks, 28% reported uncertainty about government regulations, 11% reported a maturing asset base, and a handful of firms noted labor shortages and availability of capital.
Chart 5. Special Question - Which of the following is the biggest drag on crude oil and natural gas production growth for your firm?
Skip to data visualization table| Response | Percent |
|---|---|
| Maturing asset base | 11.1 |
| Availability and/or quality of labor | 8.3 |
| Cost inflation and/or supply-chain bottlenecks | 38.9 |
| Availability of capital | 8.3 |
| Uncertainty about government regulation | 27.8 |
| Other | 5.6 |
Selected Energy Comments
“Too much supply currently. Will force prices down and activity down. LNG ramp up in 2025 with supply flat to declining will require higher prices.” “Drilling and completion costs are continuing to increase while forward commodity prices are decreasing, putting pressure on drilling economics.”
“Inflation pressures are currently high and will need to be arrested before [natural gas production] growth can be resumed or accelerated. There are tremendous price increases tied to increased activity today.” “The proposed EPA methane rules will decimate small producers with older properties if implemented as currently written.”
“While the market price may be increasing and driving inflation through natural gas dependent products, the supply side cannot respond due to lack of infrastructure between growing supply areas and growing domestic and foreign markets. This will continue to be a driver of inflation that cost of funds will have a difficult time effecting.”
“5+ years of underspending will show up on the production side. Demand will be stronger than anticipated. Prices could be higher.”