Inflation has picked up sharply over the last two years, with year-over-year inflation, as measured by the Consumer Price Index (CPI), rising from 0.1 percent in May 2020 to 8.6 percent in May 2022. This surge in prices has drawn significant attention from monetary policymakers and earned comparisons with the 1972–74 period, when inflation followed a nearly identical trajectory and the economy entered a recession. Chart 1 shows that CPI inflation rose at a similar pace from May 2020 to May 2022 (green line) as it did from August 1972 to August 1974 (blue line). In both periods, despite minor fluctuations on a month-to-month basis, inflation increased steadily and ended up roughly 8 percentage points higher than it started.
Chart 1: The change in CPI inflation followed similar paths in 1972 and 2020
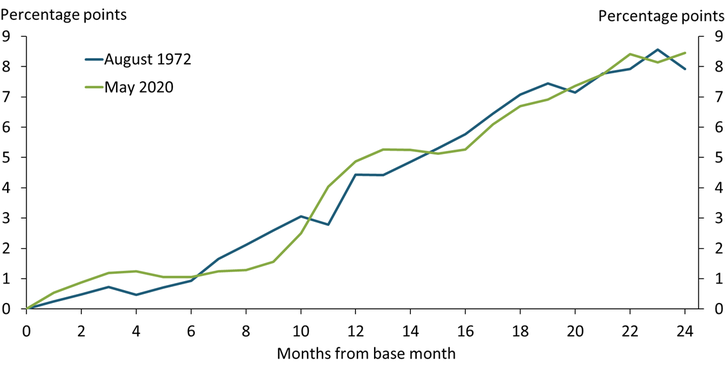
Note: Chart shows the percentage point change in year-over-year CPI inflation from the base month.
Source: U.S. Bureau of Labor Statistics (Haver Analytics).
Given these similarities, the 1972 inflationary episode may have lessons for policymakers today. From August 1972 to September 1973, the Federal Open Market Committee (FOMC) increased the federal funds rate by 6 percentage points, from 4.8 percent to 10.8 percent, an average of about 50 basis points per month. However, in October 1973, the FOMC abruptly reversed course and undertook a series of rate cuts despite continued inflationary pressures. By March 1974, the FOMC resumed rate hikes to tame inflation—even though real GDP had contracted by 3.4 percent in 1974:Q1—and the economy entered what would later be recognized as the start of a recession. Despite the rate hikes, inflation continued to rise until December 1974, when it reached its local peak of 12.3 percent. In hindsight, monetary policy historians often cite this episode as a cautionary tale that highlights the risks of trying to stimulate output before inflation has been contained (see Bernanke 2003).
Why did policymakers reverse course while inflation was still a threat? To answer this question, I use data from Coibion and others (2020) that include each FOMC participant’s reasoning for preferring tighter or looser monetary policy from 1966 to 1990. The authors construct indices for output and inflation based on the net number of participants citing these issues as justifications for their policy preferences, where lower values of each index correspond to tighter policy. For example, if five participants cited inflation as a justification for tighter policy, two participants cited inflation as justification for looser policy, and the remaining participants did not directly mention inflation (or mentioned inflation as a reason to keep policy unchanged), then the index for inflation would report a value of −3 for that meeting. These values can be compared across meetings to track how the justifications provided by policymakers change over time.
Chart 2 shows that policymakers grew increasingly concerned with curbing inflation from 1972 to 1973. In August 1972, the three-month moving average of the net number of participants citing inflation as a justification for their policy preference was about −3.7, meaning that about three to four more participants mentioned inflation as a reason to tighten policy than as a reason to loosen policy. This number is very close to the average of −3.6 from 1970 to 1971, suggesting that inflation had not yet fully taken over the FOMC’s policy discussions in the summer of 1972. The number of participants citing inflation as a justification for tighter policy rose steadily along with inflation for several months, peaking at −9 in the summer of 1973. This increase was almost double the average value from across all meetings in the 1970s, suggesting that participants had become increasingly focused on suppressing inflation.
Chart 2: Inflationary concerns dissipated before inflation did
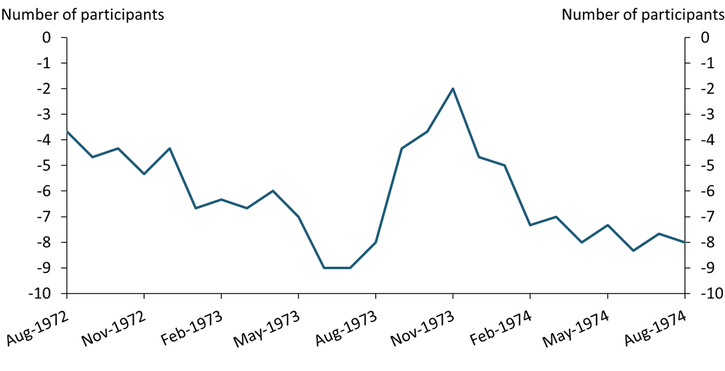
Notes: Chart shows a three-month moving average of the net number of FOMC participants who cited inflation as justification for their policy preference. Negative numbers correspond to a preference for tighter policy, while positive numbers correspond to a preference for looser policy.
Sources: Coibion and others (2020) and author’s calculations.
Chart 3, however, shows that policymakers’ concerns began shifting toward output by the end of 1973. For most of 1972–73, more FOMC participants cited output as a justification for tighter monetary policy than for looser monetary policy, suggesting they were more concerned with the economy overheating than with the pace of activity being too slow. But in late 1973, this balance began to shift: real GDP growth fell to −2.4 percent in 1973:Q3, and policymakers became increasingly likely to cite output as a justification for looser, rather than tighter, monetary policy. By the end of the year, an average of seven net participants cited output as a justification for looser policy. This increase lines up closely with the reduction in the net number of participants citing inflation as a justification for tighter policy, indicating that policymakers’ concerns had shifted even as inflation continued to climb.
Chart 3: The FOMC became more concerned about economic output in late 1973
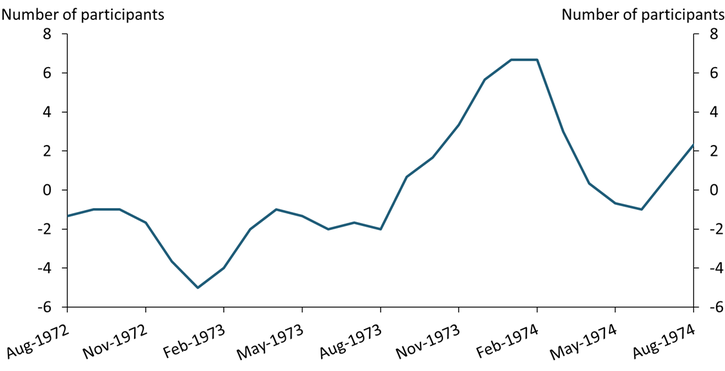
Notes: Chart shows a three-month moving average of the net number of FOMC participants who cited output or employment as justification for their policy preference. Negative numbers correspond to a preference for tighter policy, while positive numbers correspond to a preference for looser policy.
Sources: Coibion and others (2020) and author’s calculations.
The transcripts during this period hint at several exceptional circumstances that likely contributed to the FOMC’s hesitancy to raise interest rates. The most pressing of these was the surge in oil prices that resulted from an embargo proclaimed by a coalition of oil-exporting countries led by Saudi Arabia. The embargo lasted from October 1973 through March 1974, during which U.S. oil prices more than doubled, from less than $4 per barrel to more than $10 per barrel. This surge in energy prices was closely linked to the shift in the Committee’s focus away from fighting inflation and toward supporting output.
Although oil prices were a key driver of the FOMC’s policy shift in 1973, the transcripts mention several other extraordinary circumstances that likely pushed the Committee to take a more cautious approach to fighting inflation. One of these was the collapse of the Bretton Woods System, which led to the United States moving off the gold standard and many countries adopting floating exchange rates. The March 1973 transcript quotes a briefing provided to the Committee that suggests the international financial system had “broken down so completely that it is difficult to describe even in general terms what is left of the system and how it may be expected to function in the future” (Board of Governors 1973, p. 61). Another unusual circumstance during this period was the United States’ withdrawal from Vietnam, which was cited both as a potential driver of geopolitical uncertainty and a shock to domestic labor markets as U.S. soldiers returned home. These factors help explain why policymakers during the 1972 inflation cycle ultimately decided to reverse course and shift to a more accommodative monetary policy stance before inflation had been tamed.
The 1972 episode stands in contrast to the Fed’s subsequent success in taming inflation in the early 1980s, when Fed chair Paul Volcker undertook a path of aggressive policy tightening that was maintained even as unemployment soared. While policy in the 1980s illustrates the importance of sticking with the fight against inflation even when the economy is underperforming, the response of the FOMC to the 1972 inflation cycle serves as a cautionary tale for current policymakers, who have been quick to cite exceptional circumstances—such as the COVID-19 pandemic, supply chain disruptions, and Russia’s invasion of Ukraine—as justifying a cautious approach to monetary policy in their policy statements. The Fed’s experience in the 1970s suggests that, regardless of extenuating circumstances or potential slowdowns in activity, the FOMC will ultimately be judged by its willingness to maintain the fight against inflation until it has been fully contained.
References
Bernanke, Ben. 2003. “External LinkA Perspective on Inflation Targeting.” Remarks at the Annual Washington Policy Conference of the National Association of Business Economists, Washington, DC, March 25.
Board of Governors of the Federal Reserve System. 1973. “External LinkFederal Open Market Committee Memorandum of Discussion, March 19–20, 1973.”
Coibion, Olivier, Marc Dordal i Carreras, Yuriy Gorodnichenko, and Cooper Howes. 2020. “What Do We Learn from Reading Every FOMC Transcript?” Unpublished working paper.
Cooper Howes is an economist at the Federal Reserve Bank of Kansas City. The views expressed are those of the author and do not necessarily reflect the positions of the Federal Reserve Bank of Kansas City or the Federal Reserve System.