As economic shocks from the COVID-19 pandemic move further into the rear view, hybrid work policies and preferences appear here to stay (Brown and Tousey 2023). Recent data suggest that about 30 percent of working days in 2023 took place at home (Barrero and others 2024). Moreover, in the largest metros, office occupancy is down at least 40 percent relative to its pre-pandemic level (Kastle 2024). This reduced occupancy, in turn, may influence foot traffic from office workers to nearby businesses.
Chart 1 shows that since 2020, vacancy rates for office space have risen across the country (gray line) and in most of the Tenth Federal Reserve District—a region that includes Colorado, Kansas, Nebraska, Oklahoma, Wyoming, and portions of Missouri and New Mexico. Vacancy rates are expected to continue to rise as businesses continue to reevaluate space needs in a hybrid work environment. For example, research from the Federal Reserve Bank of Kansas City suggests hybrid working may have long-lasting effects on commuting, home construction, and business location (Rappaport 2022, 2021).
Chart 1: Office vacancy rates are increasing in most of the Tenth District and across the country
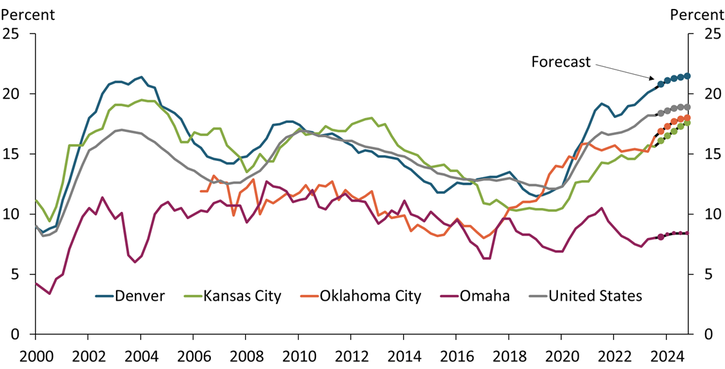
Source: CBRE-EA.
The effects of these higher vacancy rates are likely to vary across the country, as office space is distributed differently in each state. Map 1 displays the share of all office space currently located in “office-dense” areas, measured as zip codes with at least 1 million square feet of office space per square mile._ In the Tenth District, the share of office space in office-dense areas ranges from 0 percent (Wyoming) to 33.5 percent (Colorado). Most Tenth District states, however, have a lower share of office space in office-dense areas than the national average. Excluding the three states with the highest share of office space in office-dense areas—New York, Massachusetts, and Illinois—the nationwide average is 19.1 percent.
Map 1. Most Tenth District states have a lower share of total office space in office-dense areas
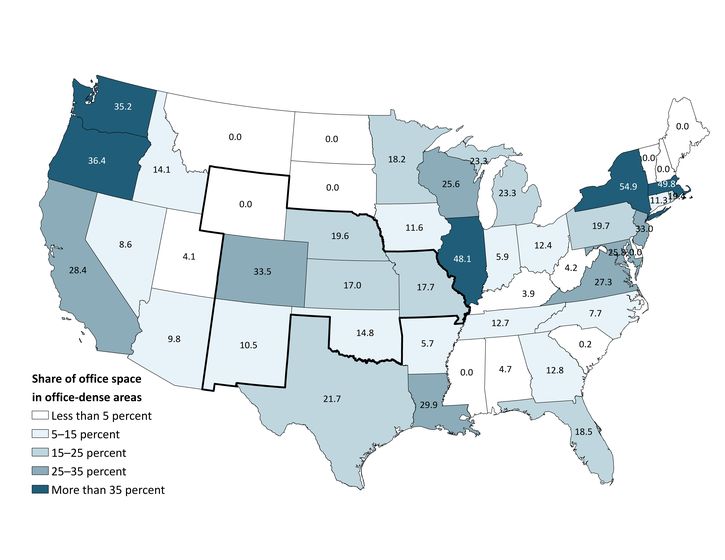
Notes: The share of office space in office-dense areas reflects the most recent assessment information from public records data. Approximately 95 percent of properties included have been assessed since 2020.
Sources: CoreLogic and author’s calculations.
Although most Tenth District states have less office space in office-dense areas than the national average, businesses in these areas may still be hit by the effects of hybrid work. Bars and restaurants are especially dependent on foot traffic, making them potentially more vulnerable to any drop in traffic to the zones in which they are located. Chart 2 shows that prior to the pandemic, the share of bars and restaurants in office-dense areas was much higher in Colorado and Nebraska than in other Tenth District states and the nationwide average._ Given this higher proportion, bars and restaurants in Colorado and Nebraska may be especially vulnerable to any loss of office-worker foot traffic since the pandemic.
Chart 2. Share of bars and restaurants in office-dense areas is higher in Colorado and Nebraska
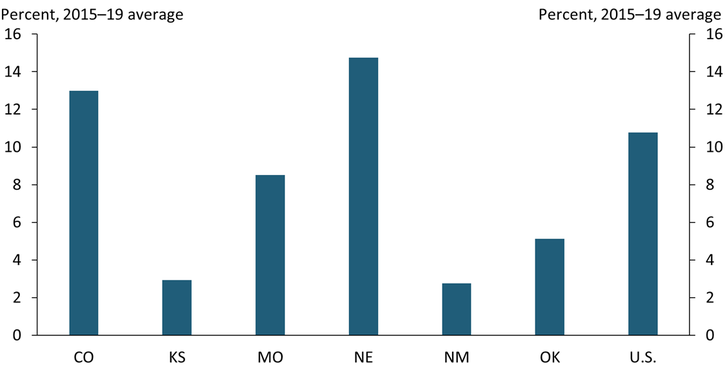
Note: Office-dense locations are zip codes with at least one million square feet of office space per square mile.
Sources: U.S. Census Bureau, CoreLogic, and author’s calculations.
One way to assess how foot traffic in office-dense locations has evolved is to compare changes in the population of an area during work hours relative to non-work hours. Chart 3 displays the ratio of the daytime population to the resident population in non-working hours in office-dense zip codes, accounting for local work-from-home rates following the onset of the pandemic._ A value above one indicates that during the workday, the population of office-dense areas increases over the resident population. The blue bars show that prior to the pandemic, the population in the office-dense areas in some Tenth District states increased substantially during work hours. In Kansas, for example, the population in office-dense areas increased, on average, more than four-fold. During the pandemic (green bars), this ratio declined across the country as more employees worked remotely. Although the ratio increased slightly in 2023 (orange bars) as hybrid work increased foot traffic to office-dense areas, it has yet to return to its pre-pandemic level in any state.
Chart 3. Increases in population during workday in office-dense areas has fallen since the pandemic
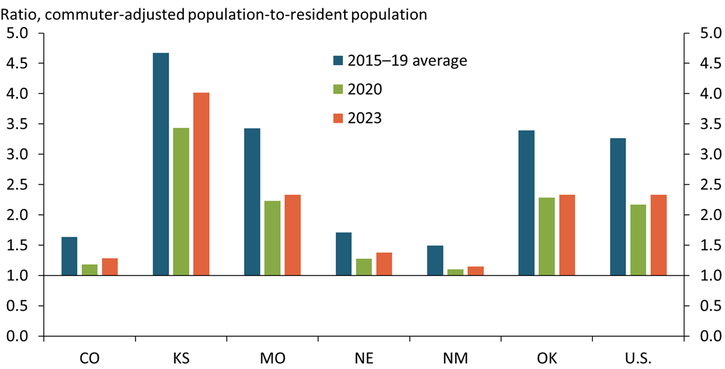
Note: The 2023 ratio applies the average work-from-home rate for 2023 to employment levels in 2021, the last year for which data are available at the zip code level.
Sources: U.S. Census Bureau (IPUMS USA), WFH Research, CoreLogic, and author’s calculations.
Comparing Charts 2 and 3 may shed light on the states in which bars and restaurants are most vulnerable to declining foot traffic. For example, although Colorado and Nebraska had a higher share of bars and restaurants in office-dense areas prior to the pandemic (Chart 2), they also relied much less on commuter foot traffic than other Tenth District states or the nationwide average (Chart 3). As a result, bars and restaurants in these states may be less vulnerable to the effects of hybrid work. In contrast, bars and restaurants elsewhere in the Tenth District appear similarly vulnerable to bars and restaurants in the nation as a whole. Although these Tenth District states have fewer bars and restaurants located in office-dense areas, the bars and restaurants that are located there relied on office-worker foot traffic prior to the pandemic at a similar or higher rate than the nation as a whole. In these states, as in the rest of the nation, daytime foot traffic in office-dense areas has yet to return to pre-pandemic levels.
Ultimately, the degree of vulnerability posed by hybrid work to businesses such as bars and restaurants depends on more than just the concentration and prevalence of office commuters. Other factors, such as proximity to entertainment venues, can also influence foot traffic to businesses. Although office vacancy rates may be forecast to rise in most places, strategies to increase foot traffic for non-work purposes could reduce vulnerability for businesses located in office-dense areas.
Download Materials
Endnotes
-
1
Office space is the sum of building square feet as provided at the property level by CoreLogic. I include four CoreLogic property categories in the calculation to be as inclusive as possible: commercial, commercial condo, office building, and financial institution.
-
2
While not shown in Chart 2, this trend has not meaningfully changed in the years since the pandemic.
-
3
Zip-code level commuter totals follow a External Linkformula provided by the U.S. Census Bureau and are found by adding the total population in the area (2015–19 American Community Survey five-year estimates) to the total number of workers in the area (zip code business patterns) and then subtracting the total number of workers living in the area (2015–19 ACS five-year estimates). I measure the number of employees working less than a full week in the office using estimated work-from-home rates provided for groups of cities by Barrero and others (2024).
References
Barrero, Jose Maria, Nicholas Bloom, Shelby Buckman, and Steven J. Davis. 2024. “External LinkSWAA January 2024 Updates.” WFH Research, January 18.
Brown, Jason P., and Colton Tousey. 2023. “External LinkThe Shifting Expectations for Work from Home.” Federal Reserve Bank of Kansas City, Economic Review, vol. 108, no. 2, pp. 25–46.
Kastle. 2024. “External LinkWeekly Occupancy Report from Kastle Access Control System Data.” Accessed January 22.
Rappaport, Jordan. 2022. “External LinkHybrid Working, Commuting Time, and the Coming Long-Term Boom in Home Construction.” Federal Reserve Bank of Kansas City, Economic Review, vol. 107, no. 4, pp. 5–39.
———. 2021. “External LinkHybrid Officing Will Shift Where People and Businesses Decide to Locate.” Federal Reserve Bank of Kansas City, Economic Bulletin, February 2.
John McCoy is an associate economist at the Federal Reserve Bank of Kansas City. The views expressed are those of the author and do not necessarily reflect the positions of the Federal Reserve Bank of Kansas City or the Federal Reserve System.