Most businesses—regardless of industry, location, or size—are straining to procure the materials and inputs they need to meet demand from their customers._ Alongside physical delays, a prominent source of those strains is the rising cost to transport and deliver the parts businesses require to assemble goods or provide services. Global shipping rates for any mode of transportation have increased substantially over the past 18 months. Chart 1 shows that these increases in shipping prices are unprecedented in both size and duration, leading businesses to consider how to respond.
Chart 1: Freight rates are elevated across modes of transportation
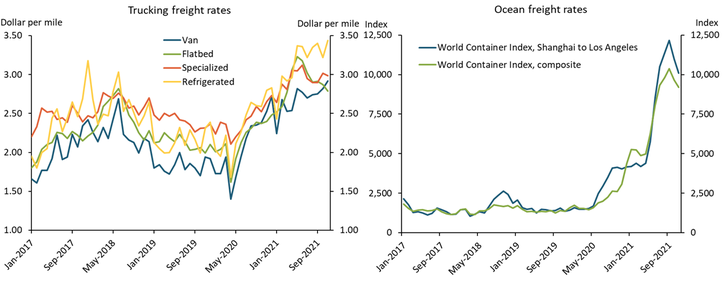
Sources: Drewry and Truckstop.com. Both sources accessed through Bloomberg.
Although nearly all businesses are facing rising cost pressures from higher international freight rates, the types of businesses prevalent in the region of the Tenth Federal Reserve District—which encompasses Colorado, Kansas, Nebraska, Oklahoma, Wyoming, and parts of Missouri and New Mexico—appear less willing or able to circumvent them. During the latter half of 2021, total import charges nationwide, which include freight and insurance costs, were 40 percent higher than they were in 2019. Map 1 illustrates how the growth in freight costs associated with imported materials in 2021 was distributed across states. States shaded in yellow saw a substantial rise in the total shipping costs for imported materials, with darker shades indicating greater increases. States shaded in blue experienced less severe, though still substantial, increases in global shipping expenses, with darker shades indicating smaller increases. The map highlights that most Tenth District states had a greater exposure to increases in freight costs for imported materials.
Map 1: In 2021, total global shipping costs grew faster in the Tenth District
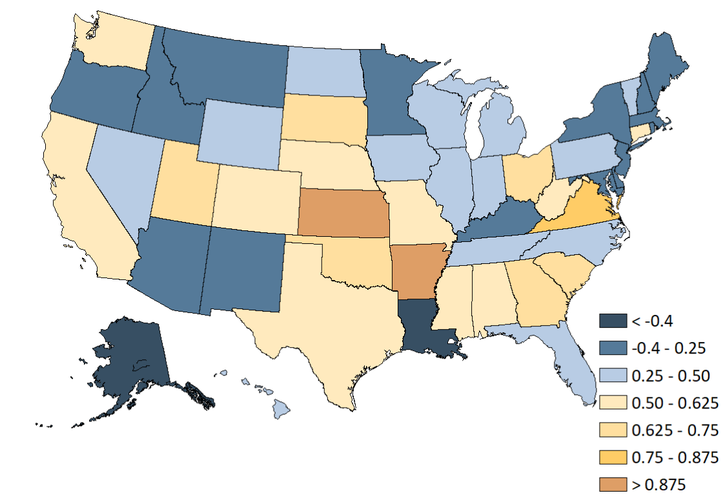
Notes: Total freight charges and import values are calculated excluding petroleum imports. Values illustrated in map are percentage point changes in total shipping costs as a share of total imports.
Sources: U.S. International Trade Commission, U.S. Census Bureau, and authors’ calculations.
Previous work at the Kansas City Fed shows that these shipping cost pressures indeed pass through to overall price inflation, highlighting the need to understand the regional drivers of shipping cost pressures (Herriford and others 2016). We see four key factors contributing to greater increases in shipping costs for businesses throughout the Great Plains and Rocky Mountain regions. First, several states within the Tenth District bear a larger marginal cost of managing global supply chains in general, not just during the pandemic. On average, freight and other shipping costs amounted to approximately 2.7 percent of the total value of goods being imported into the United States during 2019. However, in Wyoming and Oklahoma, the freight costs were nearly 100 basis points higher than the national average. The blue bars in Chart 2 show that global freight costs in 2019 were higher in these states as well as in Missouri prior to the pandemic, leading the average cost burden in the Tenth District to slightly exceed the average nationwide.
Chart 2: Several states in the KC Fed District incur an outsized burden of international shipping costs
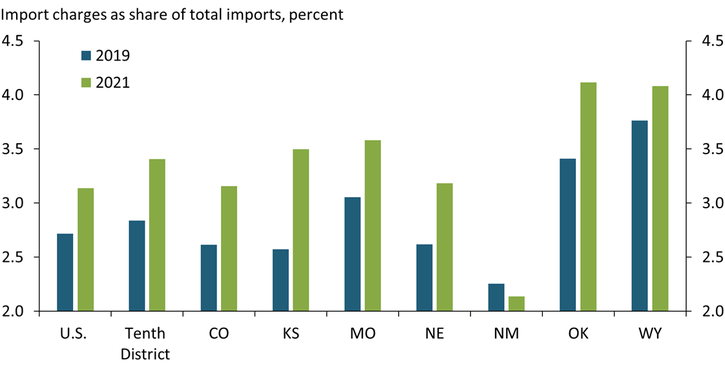
Sources: U.S. International Trade Commission, U.S. Census Bureau, and authors’ calculations.
Second, in addition to being somewhat higher initially, shipping costs grew faster in the Tenth District over the past year as freight and other shipping prices climbed to new heights. The green bars in Chart 2 show that freight and insurance costs grew so substantially from their 2019 levels for businesses common in Colorado, Kansas, and Nebraska that they now exceed the U.S. average.
Third, businesses in the Tenth District are more likely to import goods that they cannot easily adjust their purchases of, even when costs rise. Some imported goods have more substitutes available or can be transported in various ways, allowing businesses to avoid some of the rise in shipping costs by adjusting their sourcing strategies. For example, shampoos used at salons or hotel chains come in many varieties and can be easily transported alongside other items. In contrast, inputs into aerospace manufacturing or bespoke steel piping for oil and gas producers often have tight specification requirements and particular transportation constraints, making substitutions less viable. As a result, producers that depend on these specialized inputs are likely to bear more of the burden of rising shipping costs. The differences in how businesses respond to changing import costs for a specific product can be summarized by a measure called import demand elasticity._
The inputs and materials states import vary according to the composition of their businesses and industries. These differences position some states to better adjust in response to common shocks, such as an increase in global shipping costs, and leave other states more exposed to the burdens of supply chain disruptions. We estimate state-specific import demand elasticities based on the distinct portfolio of goods imported into each state, which are shown in Map 2._ States shaded in yellow have businesses that make relatively fewer adjustments to their purchases of imported inputs as costs rise, with darker shades indicating less elastic demand. States shaded in blue, on the other hand, have businesses that tend to adjust their purchases of key inputs more when costs rise, with darker shades indicating more elastic demand. Several Tenth District states exhibit relatively inelastic demands for the products they import, indicating less willingness or ability to adjust to rising costs.
Map 2: State economies differ in how they respond to rising costs for imported inputs
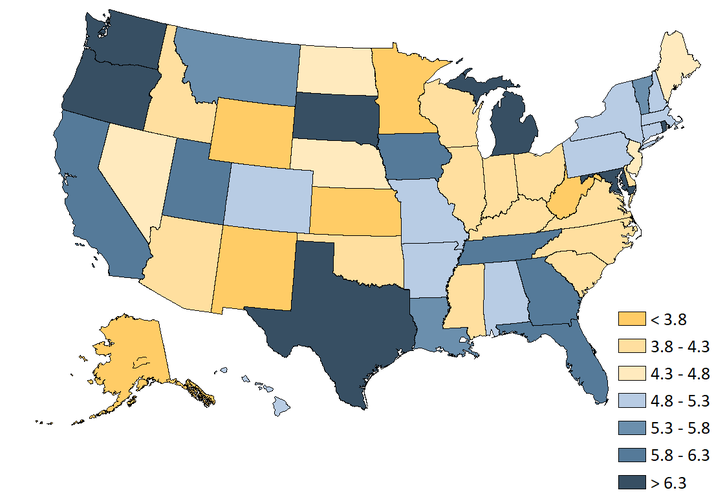
Note: The import demand elasticities are estimated for all non-oil imports into each state.
Sources: Soderbery (2015), U.S. Census Bureau, and authors’ calculations.
Fourth, rapid growth in imports has further exacerbated the pressures from rising global shipping costs. By the end of the third quarter of 2021, demand for imported goods had more than fully recovered from its pandemic-induced decline, meaning businesses were incurring greater international shipping costs on a much larger volume of internationally sourced inputs and materials. Chart 3 shows that total goods imports in the Tenth District have grown more than 30 percent above 2019 levels (green line), rising more steeply than imports for the United States as a whole (blue line).
Chart 3: Import demand has more than fully recovered and expanded faster in Tenth District states
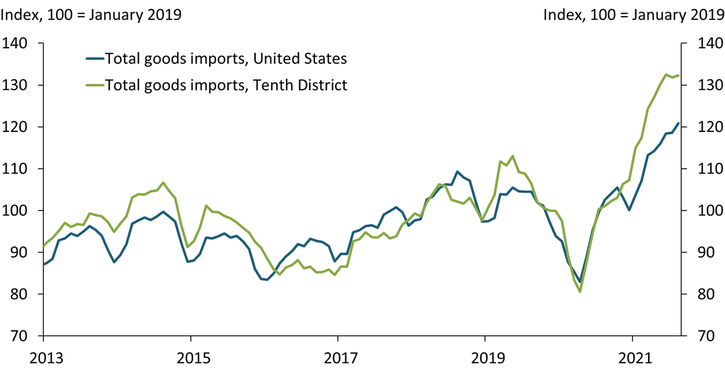
Sources: U.S. Census Bureau (Haver Analytics) and authors’ calculations.
In sum, the inputs and materials that businesses in the Tenth District tend to import are not only more expensive to transport, that expense is also rising faster than for other types of goods. Moreover, businesses are experiencing especially strong demand growth for these goods and are less able to adjust their sourcing or cut back on their purchases. Altogether, these factors are driving outsized regional growth in supply chain management costs.
Supply chain disruptions and elevated shipping costs continue to be prominent challenges for businesses across the United States. These disruptions have led to higher consumer prices as well as changes to some businesses’ inventory management strategies and capital investment plans. The balance of those consequences is likely to vary from region to region. Regardless, most business contacts report that the effects of these disruptions are likely to be persistent, as freight rates remain high and delays remain long._
Endnotes
-
1
For example, from the November 2021 Beige Book report: “Several Districts noted that despite strong demand, growth was constrained by supply chain disruptions and labor shortages” (Board of Governors of the Federal Reserve System 2021, p. 1).
-
2
Specifically, import demand elasticities measure the typical change in imports, in percentage terms, for a given percentage change in import prices. Estimated elasticities for individual imported products are available from Soderbery (2015). We combine these estimates with state-level import data by product accessed via USA Trade Online from the U.S. Census Bureau.
-
3
Specifically, we calculate state-specific import demand elasticities as a weighted average of HS-6 product demand elasticities from Soderbery (2015), with weights corresponding to each product-specific share of total state non-oil imports in 2019.
-
4
See, for example, the Federal Reserve Bank of Kansas City’s External LinkDecember 2021 Manufacturing Survey, in which contacts noted that supply chain disruptions remain top risks for 2022.
References
Board of Governors of the Federal Reserve System. 2021. “External LinkThe Beige Book: Summary of Commentary on Current Economic Conditions by Federal Reserve District.” December 1.
Herriford, Trenton, Elizabeth M. Johnson, Nicholas Sly, and A. Lee Smith. 2016. “External LinkHow Does a Rise in Shipping Costs Affect U.S. Inflation?” Federal Reserve Bank of Kansas City, Economic Bulletin, December 1.
Soderbery, Anson. 2015. “External LinkEstimating Import Supply and Demand Elasticities: Analysis and Implications.” Journal of International Economics, vol. 96, no. 1, pp. 1–17.
Nicholas Sly is an assistant vice president and the Denver branch executive at the Federal Reserve Bank of Kansas City. Anson Soderbery is associate professor of economics at Purdue University. Bethany Greene, a research associate at the Bank, provided research assistance. The views expressed are those of the authors and do not necessarily reflect the positions of the Federal Reserve Bank of Kansas City or the Federal Reserve System.