Summary of Quarterly Indicators
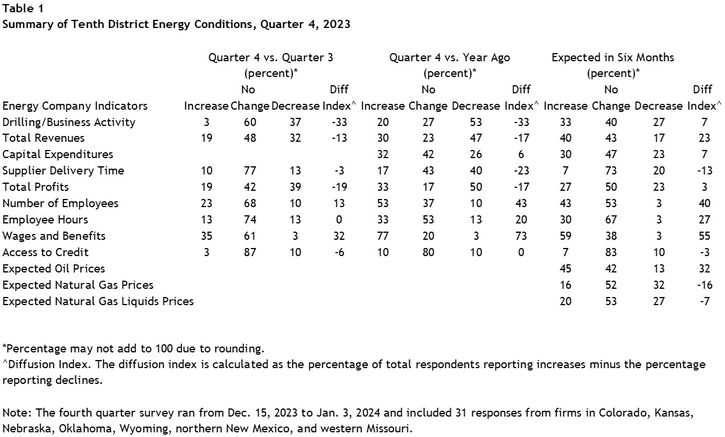
Tenth District energy activity declined sharply in the fourth quarter of 2023, as indicated by firms contacted between Dec. 15th, 2023, and Jan. 3rd, 2024 (Tables 1 & 2). The drilling and business activity index decreased from -13 to -33 (Chart 1). Profits and revenues also declined this quarter. Only the employment-related indexes had positive readings this quarter—namely the number of employees, employee hours, and wages & benefits indexes.
Chart 1. Drilling/Business Activity Indexes
Skip to data visualization table| Quarter | Vs. a Quarter Ago | Vs. a Year Ago |
|---|---|---|
| Q4 19 | -48 | -50 |
| Q1 20 | -81 | -92 |
| Q2 20 | -62 | -70 |
| Q3 20 | 4 | -71 |
| Q4 20 | 40 | -60 |
| Q1 21 | 35 | 12 |
| Q2 21 | 33 | 59 |
| Q3 21 | 43 | 68 |
| Q4 21 | 32 | 74 |
| Q1 22 | 29 | 52 |
| Q2 22 | 57 | 77 |
| Q3 22 | 44 | 78 |
| Q4 22 | 6 | 56 |
| Q1 23 | -13 | 17 |
| Q2 23 | -19 | -16 |
| Q3 23 | -13 | -23 |
| Q4 23 | -33 | -33 |
Activity also fell sharply from this time last year. Drilling/business activity, revenues, profits, and supplier delivery time all continued to post negative readings. Capital expenditures continue to expand moderately even as access to credit stays flat.
Expectations for future activity remained expansionary despite the downturn. All expectations indexes stayed positive, except for supplier delivery time, access to credit, and the expected natural gas prices. Firms anticipate activity will pick up moderately in the next six months, but profits will stay mostly flat, while the expected employment index picked up to a reading of 40.
Summary of Special Questions
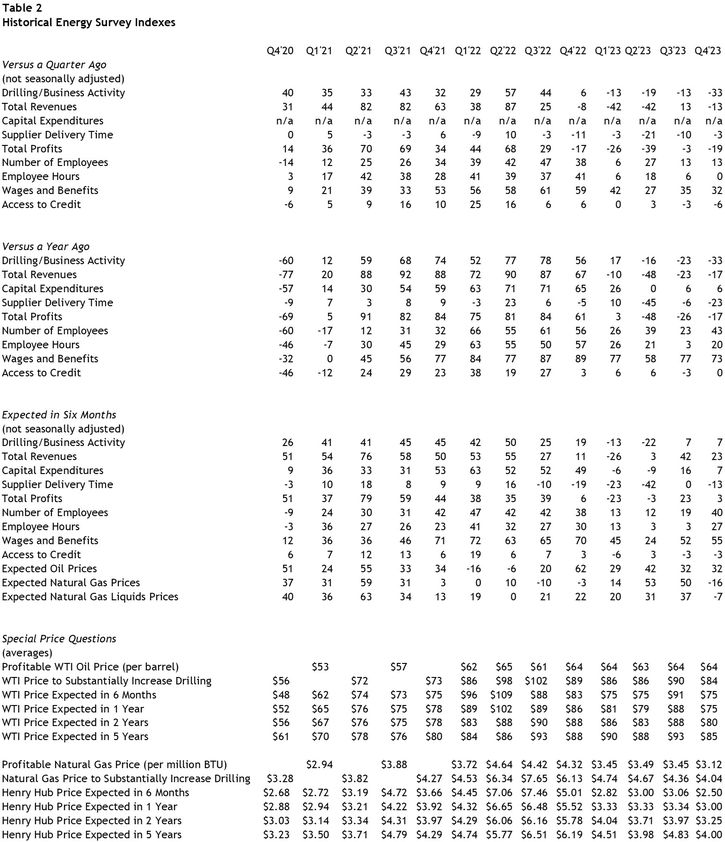
Firms were asked what oil and natural gas prices were needed on average for drilling to be profitable across the fields in which they are active. The average oil price needed was $64 per barrel (Chart 2), while the average natural gas price needed was $3.12 per million Btu (Chart 3). Firms were also asked what prices were needed for a substantial increase in drilling to occur across the fields in which they are active. The average oil price needed was $84 per barrel (Chart 2), and the average natural gas price needed was $4.04 per million Btu (Chart 3).
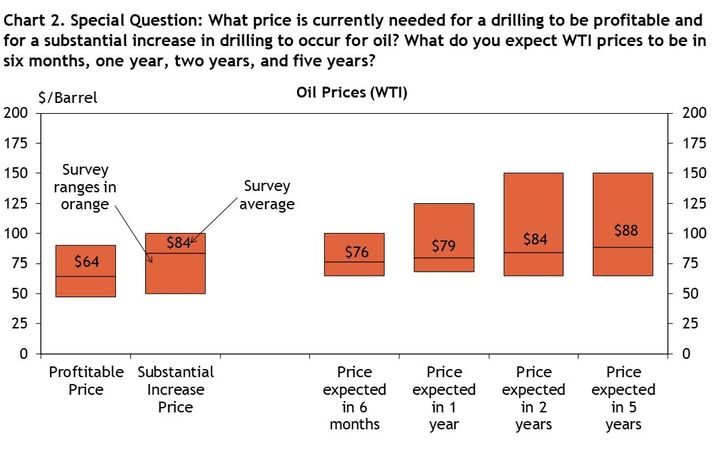
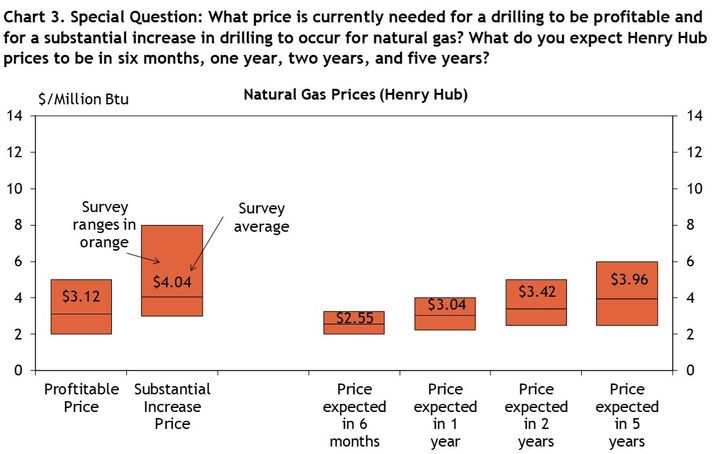
Firms reported what they expected oil and natural gas prices to be in six months, one year, two years, and five years. The average expected WTI prices were $76, $79, $84, and $88 per barrel, respectively. The average expected Henry Hub natural gas prices were $2.55, $3.04, $3.42, and $3.96 per million Btu, respectively.
Contacts were asked about their firms’ expectations in 2024 relative to 2023 (Chart 4). A strong majority of firms expect employment to either increase slightly in 2024 (43%) or remain close to 2023 levels (50%). Expectations for capital expenditures heading into the new year were mixed, with 33% each reporting expectations of a slight increase or slight decrease and 23% reporting they will remain close to 2023 levels.
Chart 4. Special Question: What are your firm's expectations in 2024 vs. 2023?
Skip to data visualization table| Response | Capital Expenditures | Employment |
|---|---|---|
| Increase significantly | 7 | 3 |
| Increase slightly | 33 | 43 |
| Remain close to 2023 levels | 23 | 50 |
| Decrease slightly | 33 | 3 |
| Decrease significantly | 3 | 0 |
District energy firms were also asked how much they expect key input prices to change from December 2023 to December 2024 (Chart 5). Only 3% reported they expect a significant increase, 30% reported a slight increase, 57% anticipate they will remain close to 2023 levels, and 10% expect a slight decrease.
Chart 5. Special Question: By how much do you expect prices for your firm's key inputs to change from December 2023 to December 2024?
Skip to data visualization table| Response | Percent |
|---|---|
| Increase significantly | 3.0 |
| Increase slightly | 30 |
| Remain close to 2023 levels | 57.0 |
| Decrease slightly | 10 |
| Decrease significantly | 0 |
Selected Energy Comments
“World demand is rising; investment hasn’t kept pace.”
“Consolidation in the Permian will lead to more orderly development.”
“Worldwide capital expenditures remain relatively low.”
“Any meaningful rise in gas price will be met with dry gas drilling.”
“It’s very hard to predict gas prices. Most operators just try to be efficient and make money at low costs.”
“There is an abundant supply of natural gas, driven mostly as a by-product of oil drilling.”
“Lack of infrastructure will prohibit being able to develop and connect supplies to growing markets.”
“LNG send-out capacity is currently driving domestic gas supplies. Current gas prices are insufficient to add new dry gas production.”
“Consolidation is more prevalent.”
“Well design optimization has been the most impactful use of AI. But AI is being utilized in all aspects of our business.”