Syndicated loans, which allow a group of lenders to jointly fund a large loan, are an important source of funding for corporate borrowers. Corporate borrowers have largely seen credit costs decline during the recovery from the Great Recession, as syndicated loan valuations have soared and interest rate spreads relative to benchmark rates have decreased._ However, this aggressive loan pricing—coupled with indications that credit protections have weakened since the crisis—has sparked concerns. Some analysts fear that these loans may suffer swift corrections, resulting in losses to bank and nonbank portfolios (Fleming 2018; Haunss 2018). Market observers are particularly concerned about loans to highly leveraged firms—those already holding relatively high debt burdens—which may default should corporate profitability fall or interest expenses rise quickly.
To assess whether highly leveraged firms are driving the recent decline in spreads, we examine syndicated loan spreads across loan and borrower types. Chart 1 shows the four-quarter moving average of revolving loan spreads weighted by loan size. The green line shows spreads charged to highly leveraged firms, defined as those with debt levels at or greater than four times earnings before interest, taxes, and depreciation (EBITDA)._ The blue line shows spreads charged to less leveraged firms, which have a debt-to-EBITDA ratio lower than four.
Loan spreads charged to both borrower groups follow similar patterns throughout the sample period. Premiums charged to highly leveraged borrowers, however, have fallen somewhat compared with their pre-crisis averages as evidenced by a tighter gap in loan spreads between those borrowers and their less leveraged peers. Nevertheless, revolving loan spreads across all borrower types remain above their pre-crisis levels, possibly reflecting greater risk aversion, regulatory considerations, or trade-offs related to other contract features._
Chart 1: Weighted Average Revolving Loan Spreads
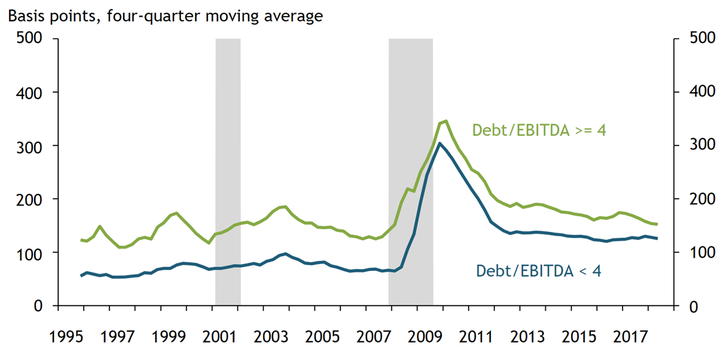
Note: Debt-to-EBITDA based on trailing 12-month average at lagged loan origination quarter.
Sources: Refinitiv LPC Dealscan, S&P Global Market Intelligence Compustat, and Cohen and others (2018).
Premiums charged to highly leveraged borrowers have also recently declined for term loans. Chart 2 shows four-quarter moving average term loan spreads weighted by loan size. Term loan spreads are higher than revolving loan spreads, likely reflecting longer maturities and greater credit risk. Term loan spreads also appear to be more sensitive to the business cycle, rising in economic contractions and falling during expansions. Since the financial crisis, term loan spreads have declined continuously for all borrower types, although the premium charged to highly leveraged borrowers has fluctuated. Immediately after the crisis, the leverage loan premium was somewhat elevated compared with historical levels. Since early 2016, however, the leveraged loan premium began to drop and is nearing historically low levels.
Chart 2: Weighted Average Term Loan Spreads
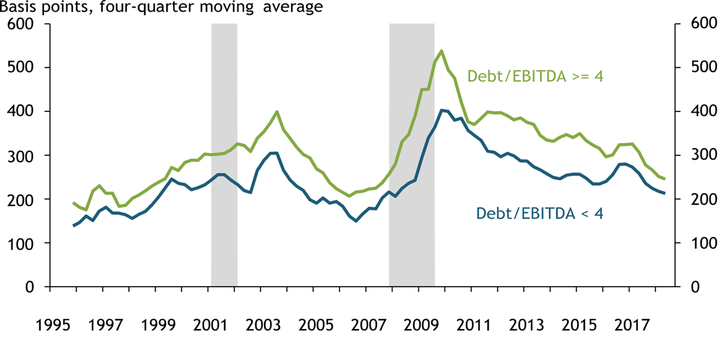
Note: Debt-to-EBITDA measure based on trailing 12-month average in lagged loan origination quarter.
Sources: Refinitiv LPC Dealscan, S&P Global Market Intelligence Compustat, and Cohen and others (2018).
While the graphical results show that leveraged loan premiums have declined, overall borrower riskiness may have declined along with spreads. To address this possibility, we estimate leveraged loan premiums after controlling for loan and borrower characteristics as well as quarterly economic shocks common to all borrowers._ Chart 3 plots the estimated leveraged loan premiums across loan types at various borrower leverage levels. The results show that spreads increase with borrower leverage as expected. Loan spreads for a revolving loan borrower with a debt-to-EBITDA ratio of four, for example, would be 40 basis points higher in the pre-crisis period than a borrower with a debt-to-EBITDA ratio below four. During the same period, loan spreads for a revolving loan borrower with a debt-to-EBITDA ratio above six would be 85 basis points higher than a borrower with a debt-to-EBITDA ratio below four.
Chart 3: Effect of Leverage on Syndicated Loan Spreads
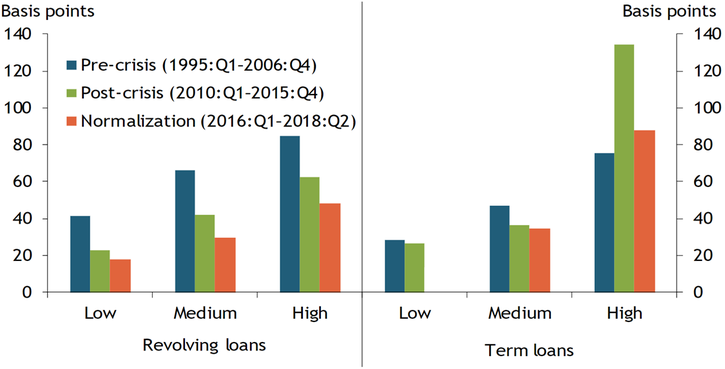
Note: Low-leveraged borrowers have debt-to-EBITDA ratios from four to five, medium-leveraged borrowers have ratios from five to six, and high-leveraged borrowers have negative debt-to-EBITDA ratios or ratios at or above six. Borrowers with debt-to-EBITDA from zero to four are the omitted group. Regressions include firm size and profitability, loan characteristics, and industry, loan purpose, and quarter fixed effects. The pale orange bar for low-leverage term loans indicates the coefficient is not statistically different from zero. All other coefficients are statistically significant at the five percent level or below.
Sources: Refinitiv LPC Dealscan, S&P Global Market Intelligence Compustat, Cohen and others (2018), and authors’ calculations.
However, the leveraged loan premium for a given level of leverage has declined over time. For example, in the pre-crisis period, spreads for the most highly leveraged borrower obtaining a revolving loan would be an additional 85 basis points higher compared to a borrower with a debt-to-EBITDA ratio below four. During the post-crisis recovery period, the premium for that same borrower declined to 60 basis points, and has declined further to less than 50 basis points since 2016. We estimate consistently lower leveraged loan premiums since the financial crisis for all leverage levels and loan types with the exception of the most highly leveraged borrowers obtaining term loans. For these borrowers, leveraged loan premiums rose to historically high levels following the Great Recession. Thus, we can attribute the wider leverage premium observed immediately after the crisis (see Chart 2) to higher spreads for the riskiest borrowers. That premium has fallen sharply since 2016, but remains above its pre-crisis level.
Taken together, the results highlight two main conclusions. First, term loans spreads have fallen continuously since the crisis, while revolving loan spreads have been more stable following their declines from crisis-era peaks. Second, premiums charged to leveraged borrowers appear to have fallen across loan types, particularly since 2016. We offer two possible explanations for these conclusions. Investor class differences likely explain differences in spread behavior across loan types. Revolving and term loans are usually funded by different lender types, and investment behavior across those lenders has varied in the post-crisis period (Lee, Liu, and Stebunovs 2017; Aramonte, Lee, and Stebunovs forthcoming). Revolving loans are generally held by banks who are able to take on the liquidity risk of funding committed credit lines. Conversely, nonbanks are more likely to hold riskier term loans, which are fully funded at origination and have a steadier and more bond-like repayments stream than a revolving loan. Much has been written about the use of loan markets to “reach for yield” in response to low interest rates._ In particular, increased investor demand to hold syndicated loans resulting from “reach-for-yield” behavior will reduce spreads given that credit supply increases outpace borrower demand for new credit.
More recent declines in the leveraged loan spread are likely a function of interest rate expectations. The Federal Reserve embarked on monetary policy tightening in December 2015 and has gradually increased the pace of tightening. These actions, coupled with improving economic fundamentals, have increased interest rate expectations, motivating investors to look for assets that will shelter them from rising interest rates. Given that syndicated loans are typically variable rate instruments, we should expect higher investor demand for syndicated loans when interest rate expectations rise. Greater investment demand further increases credit supply, putting additional downward pressure on loan spreads.
Given their unique position in the market, banks face several additional risk factors besides lower loan spreads that may compound the effects of any market disruption. First, should investor demand to hold syndicated loans fall, banks will face pipeline risk because they originate and distribute term loans (Bruche, Malherbe, and Meisenzahl 2017). Indeed, interest rate expectations declined sharply in December 2018 amid financial market volatility, and media reports indicated that banks were offering steep discounts to sell loans to investors (Scigliuzzo, Bakewell, and Lee 2017). Second, many observers’ concerns stem from reduced credit enhancement protections on syndicated loans. Covenants and other borrower protections have declined during the post-crisis period, likely leaving lenders with less monitoring authority and fewer recourse channels should borrowers default on their loans (Griffen, Nini, and Smith 2018). Declining borrower protections could also lead to lower recovery rates than in the past if firms were to default on their loans. Third, should syndicated loan prices fall, banks may suffer mark-to-market losses on their loan holdings, thereby resulting in capital losses. Losses that extend to investment-grade loans would be particularly harmful to bank balance sheets. Finally, banks may face funding and liquidity challenges if borrowers need to draw down committed lines of credit to offset profitability declines or if other funding sources freeze. These draws hamper bank balance sheet liquidity while increasing credit risk, because a borrower’s ability to repay falls as credit balances rise.
Endnotes
-
1
According to the S&P/LSTA U.S. Leveraged Loan 100 Index, secondary prices of the 100 largest traded syndicated loans have rebounded significantly since July 2009, the official start of the recovery. The average bid price has increased 22.2 percent, from $79.18 on July 1, 2009, to $96.74 on February 12, 2019. The total index value, which is a total return measure that includes interest earnings, has increased 70 percent over the same period.
-
2
Our main data source is the Refinitiv LPC Dealscan database, which collects loan characteristics (including LIBOR spreads) on newly originated syndicated loans. Our loan sample includes completed loans to U.S. borrowers denominated in U.S. dollars. Loans to the regulated and finance industries (SIC codes from 40 to 45 and 60 to 64) are excluded as are loans with missing or negative LIBOR All-In-Drawn spreads. We pair these loans with borrower balance sheets from quarterly S&P Global Market Intelligence using the methodology of Cohen and others (2018). We construct historical (rather than pro-forma) leverage ratios using 12-month trailing averages of debt and earnings. Debt-to-EBITDA ratios below the 0.5 and above the 99.5 percentile of the full sample are trimmed to exclude outliers. The final sample includes 34,157 loans with available historical debt-to-EBITDA ratios and LIBOR loan spreads, 10,733 of which are to leveraged borrowers. On average, about 66 revolving loans are to leveraged borrowers per quarter and 43 term loans are to leveraged borrowers per quarter. About 173 revolving loans and 63 term loans per quarter are to less than highly leveraged borrowers. The sample ends in 2018:Q2 due to Compustat data availability.
-
3
Griffin, Nini, and Smith (2018) show a similar result and argue that the post-crisis increase reflects compensation for reduced covenant strength.
-
4
In addition to the main specification, we try an assortment of robustness checks including removing loans used to finance M&A transactions and alternating leverage splits for borrowers with debt-to-EBITDA ratios from four to six, above six, or with negative EBITDA. The results are qualitatively similar in these specifications.
-
5
See for example Kurtzman, Luck, and Zimmerman (2018); Aramonte, Lee, and Stebunovs (forthcoming); and Temesvary, Ongena, and Owen (2018).
References
Aramonte, Sirio, Seung Jung Lee, and Viktors Stebunovs. Forthcoming. “Risk-Taking and Low Longer-term Interest Rates: Evidence from the U.S. Syndicated Loan Market.” Journal of Banking & Finance.
Bruche, Max, Frederic Malherbe, and Ralf R. Meisenzahl. 2017. “Pipeline Risk in Leveraged Loan Syndication.” Board of Governors of the Federal Reserve System, Finance and Economics Discussion Series no. 2017-048.
Cohen, Gregory J., Melanie Friedrichs, Kamran Gupta, William Hayes, Seung Jung Lee, W. Blake Marsh, Nathan Mislang, Maya Shaton, and Martin Sicilian. 2018. “PDFThe U.S. Syndicated Loan Market: Matching Data.” Federal Reserve Bank of Kansas City, Research Working Paper no. 18-09, December.
Fleming, Sam. 2018. “External LinkJanet Yellen Sounds Alarm over Plunging Loan Standards,” Financial Times, October 24.
Griffin, Tom, Greg Nini, and David Smith. 2018. “Losing Control: The 20-Year Decline in Loan Covenant Restrictions.” Working paper, November.
Haunss, Kristen. 2018. “Regulators Concerned about Material Loosening in Leveraged Loan Market,” Reuters, October 24.
Kurtzman, Robert, Stephan Luck, and Tom Zimmerman. Forthcoming. “Did QE Lead Banks to Relax Their Lending Standards? Evidence from the Federal Reserve’s LSAPs.” Journal of Banking & Finance.
Lee, Seung Jung, Lucy Qian Liu, and Viktors Stebunovs. 2017. “Risk-Taking and Interest Rates: Evidence from Decades in the Global Syndicated Loan Market.” Board of Governors of the Federal Reserve System, International Finance Discussion Papers no. 1188, January.
Scigliuzzo, Davide, Sally Basekwell, and Lisa Lee. 2019. “External LinkBanks Offer Bargains on Unwanted Leveraged Loans,” Bloomberg, January 11.
Temesvary, Judit, Steven Ongena, and Ann L. Owen. 2018. “A Global Lending Channel Unplugged? Does U.S. Monetary Policy Affect Cross-Border and Affiliate Lending by Global U.S. Banks?” Journal of International Economics, vol. 112, pp. 50–69.
The authors thank without implication Dan Li, Rajdeep Sengupta, and Jim Wilkinson for helpful comments. The views expressed are those of the authors and do not necessarily reflect the positions of the Federal Reserve Bank of Kansas City, the Board of Governors, or the Federal Reserve System.