In response to rising inflation, the Federal Reserve has increased the federal funds rate by 5.25 percentage points since March 2022, its fastest pace of rate hikes in the modern era. Raising the federal funds rate indirectly increases a broader range of interest rates and hence borrowing costs throughout the economy, which can slow consumer spending and business investments and help reduce inflation. However, by reducing demand, tightening monetary policy can also lead to layoffs and higher unemployment (Bernanke and Blinder 1992).
So far, the Fed’s recent policy tightening appears to have affected interest-rate-sensitive sectors but had a limited effect on the labor market. The green bars in Chart 1 show that housing sales, used vehicle prices, wholesale and retail sales, and private investment have declined since the tightening cycle began. In contrast, unemployment and layoff rates have remained nearly unchanged throughout the tightening period.
Chart 1: The Fed’s policy tightening has affected private investment and interest-rate-sensitive sectors, but not the labor market
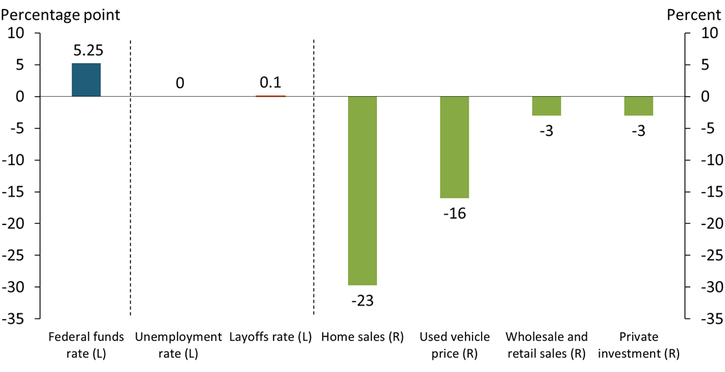
Notes: The blue and orange bars show a percentage point difference, while the green bars show a percent change. The change in the federal funds rate is from February 2022 to July 2023. Home sales and used vehicle prices are from February 2022 to July 2023, seasonally adjusted. Wholesale and retail sales are from February 2022 to June 2023, seasonally adjusted. Private investment is the seasonally adjusted annual rate from 2022:Q2 to 2023:Q2. The unemployment rate is from February 2022 to August 2023, and the layoffs rate is from February 2022 to July 2023.
Sources: Board of Governors of the Federal Reserve System, U.S. Bureau of Labor Statistics (BLS), U.S. Bureau of Economic Analysis, U.S. Census Bureau, National Association of Realtors (Haver Analytics), and Manheim (Haver Analytics).
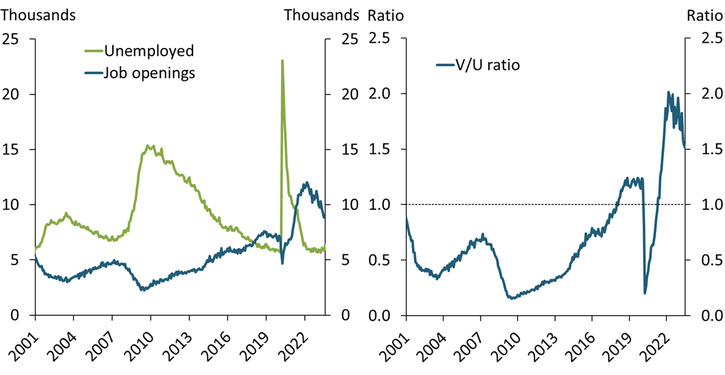
Unprecedented labor shortages in the post-pandemic period have likely contributed to a strong labor market that so far seems to be resilient to the effects of monetary policy tightening. A common approach to measuring labor shortages is to compare the number of job openings in the economy (a proxy for labor demand) to the number of unemployed individuals (a proxy for labor supply). The left panel of Chart 2 shows that for most of the past two decades, the U.S. labor market had more unemployed workers (green line) than unfilled jobs (blue line). However, this situation reversed with the onset of the COVID-19 pandemic in early 2020, and the labor market now has far more unfilled jobs than available workers._
Chart 2: The labor market has experienced significant shortages in the post-pandemic period
Sources: BLS, U.S. Census Bureau, and authors’ calculations.
The vacancies-to-unemployment (V/U) ratio, a popular measure of the severity of labor shortages, suggests the labor market is currently tight. If the ratio of job openings to unemployed individuals is under 1, the labor market is considered “slack,” as there are more unemployed workers than available jobs; if it is above 1, the labor market is considered “tight,” as there are more unfilled jobs than workers to fill them (Furmann and Powell 2021). The right panel of Chart 2 shows that the V/U ratio was mostly below 1 the past two decades, but skyrocketed to historical highs in 2020 at the onset of the pandemic. Although the V/U ratio has declined since the Fed’s tightening cycle began in March 2022, it remains elevated.
Tight labor market conditions in the post-pandemic period may make hiring new workers more challenging due to fewer available workers and increased competition for potential labor. Chart 3 summarizes responses on firms’ hiring efforts in August 2023 from the National Federation of Independent Business (NFIB) Small Business Economic Trends survey, which collects monthly information on various business indicators for a random sample of 10,000 businesses._ The first bar shows that 59 percent of respondents reported trying to hire new workers in the past month. The second bar shows that more employers said they had raised wages for existing and potential workers in the past month relative to employers who said they did not change or decrease wages (a net positive of 36 percent). Nevertheless, more respondents said they could not fill job openings in the past month relative to respondents who reported similar or less difficulty filling positions (a net positive of 40 percent).
Chart 3: Firms are raising wages yet still face difficulties in filling job openings
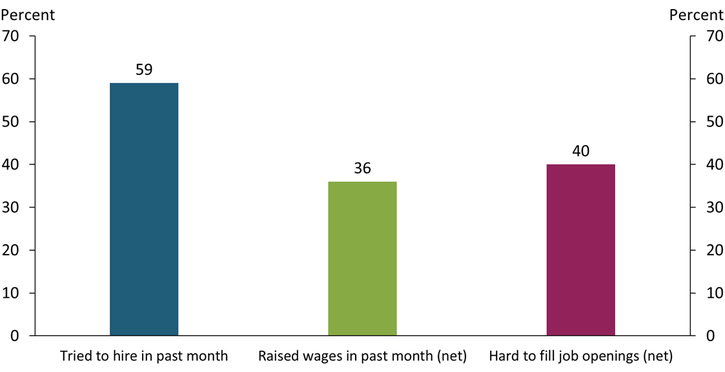
Note: Chart shows responses to selected questions from the August 2023 NFIB survey.
Source: NFIB (Haver Analytics).
The NFIB survey results suggest that many firms may be scarred by a past or current inability to hire and thus may be holding on to workers—even in the face of weak demand. The left panel of Chart 4 shows that a significant share of firms does not expect the economy or sales to improve in coming months (blue bars). Despite this pessimism, a substantial percentage of firms plans to increase employment and wages in the coming months (green bars). The stark contrast between weak expectations for demand and future hiring plans suggests that some firms may be attempting to hold on to their existing labor by raising wages and increasing employment—behavior known as “labor hoarding.”
Chart 4: Firms plan to increase employment at the cost of quality and productivity
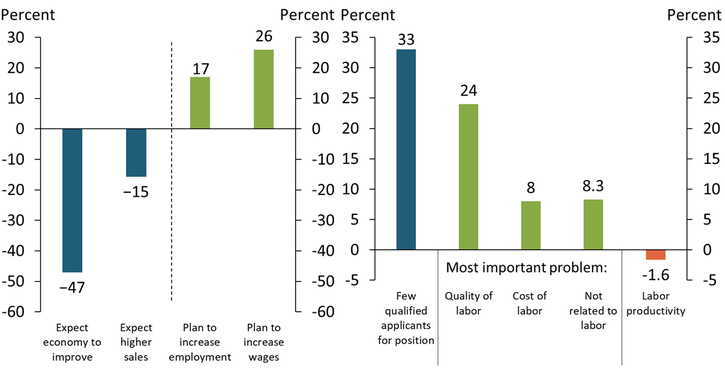
Notes: All data except labor productivity are from the July 2023 NFIB survey. Data for labor productivity—defined as real output per hour of all persons in the business sector—are from the BLS and are the year-over-year percent change for 2023.
Sources: NFIB (Haver Analytics) and BLS.
Labor hoarding can reduce the overall quality and productivity of workers across the labor force. The right panel of Chart 4 shows that 33 percent of NFIB’s survey respondents reported that there were not enough qualified applicants for open positions. If firms intend to increase employment in the coming months, many new workers may not be adequately qualified for their positions, a situation known as “skills mismatch.” In fact, 24 percent of survey respondents listed the quality of labor as their single “most important” business problem, while only 8 percent listed the cost of labor or other issues not directly related to labor (green bars)._ These responses suggest that firms are already confronting the problem of skills mismatch. Because many firms also need to increase wages to attract workers, new workers are both less qualified and getting paid higher wages, which can lower worker productivity (that is, output per hour). Indeed, national-level data show that labor productivity has declined in 2023 (orange bar).
In summary, recent data suggest that severe shortages in the post-pandemic labor market have resulted in labor hoarding and skills mismatch. These phenomena help explain why recent monetary policy tightening has had a limited effect on unemployment and layoffs. Moreover, labor hoarding and skills mismatch will likely keep wage growth high as firms try to attract new workers and prevent existing workers from leaving, but push productivity down as workers likely to be laid off or not hired in the first place remain employed. Unless labor shortages ease (either through increased supply or reduced demand), labor hoarding and skills mismatch will likely continue to be dominant features of the post-pandemic labor market.
Endnotes
-
1
As of July 2023, there were 3 million more unfilled jobs than unemployed persons.
-
2
NFIB’s national membership spans the spectrum of business operations, ranging from sole proprietor to firms with hundreds of employees. The typical NFIB member employs 10 people and reports annual gross sales of about $500,000.
-
3
The other options available for respondents are competition, insurance, finance, government, inflation, sales, taxes, and other. The chart shows the mean percent of firms reporting one of these options as their most single important problem.
Elior Cohen is an economist at the Federal Reserve Bank of Kansas City. The views expressed are those of the author and do not necessarily reflect the positions of the Federal Reserve Bank of Kansas City or the Federal Reserve System.
References
Bernanke, Ben S., and Alan S. Blinder. 1992. “External LinkThe Federal Funds Rate and the Channels of Monetary Transmission.” American Economic Review, vol. 82, no. 4, pp. 901–921.
Furman, Jason, and Wilson Powell III. 2021. “External LinkWhat Is the Best Measure of Labor Market Tightness?” Peterson Institute for International Economics (blog), November 22.