For nearly a decade, businesses in Nebraska have faced challenges finding enough workers to fill available jobs. While the pandemic exacerbated some of these challenges, other trends have constrained the availability of labor in the state for many years beforehand. Previous research has detailed both pandemic-induced distortions to the labor market and longer-term headwinds to labor force growth. This update highlights that, among the population currently in Nebraska, younger individuals have been less active in seeking employment, compounding issues associated with labor scarcity in recent years.
Unemployment has remained low in Nebraska and job openings have remained elevated.
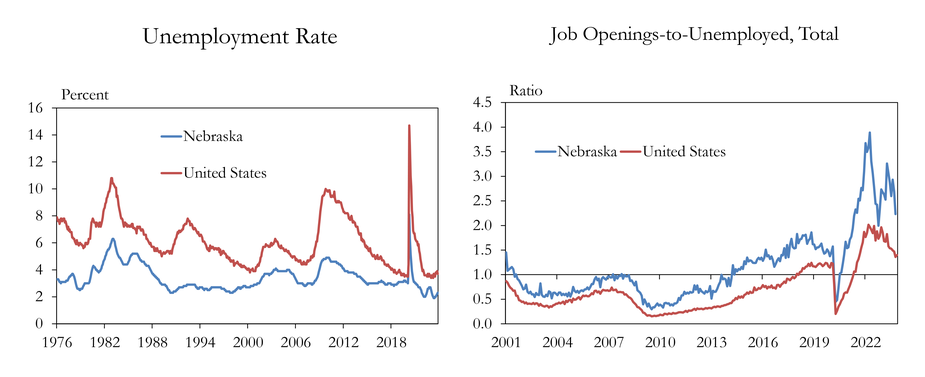
Sources: BLS, staff calculations.
Nationally, job openings in leisure and hospitality, and in education and health care, have become increasingly prominent.
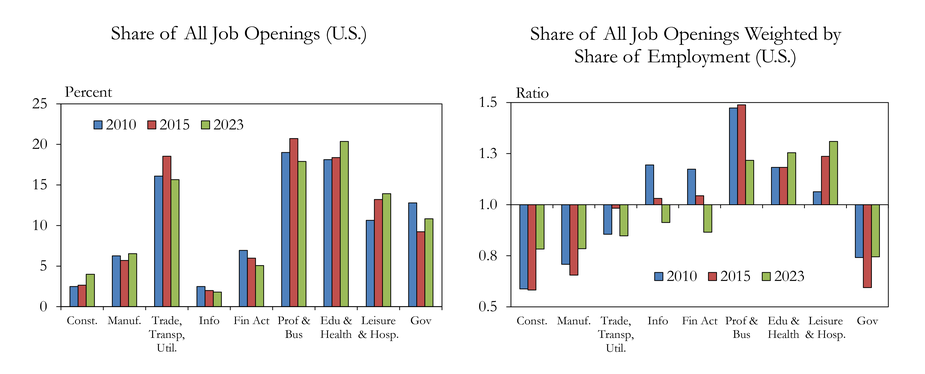
Sources: BLS, Haver Analytics.
Labor force participation has steadied somewhat alongside its longer-term trend.
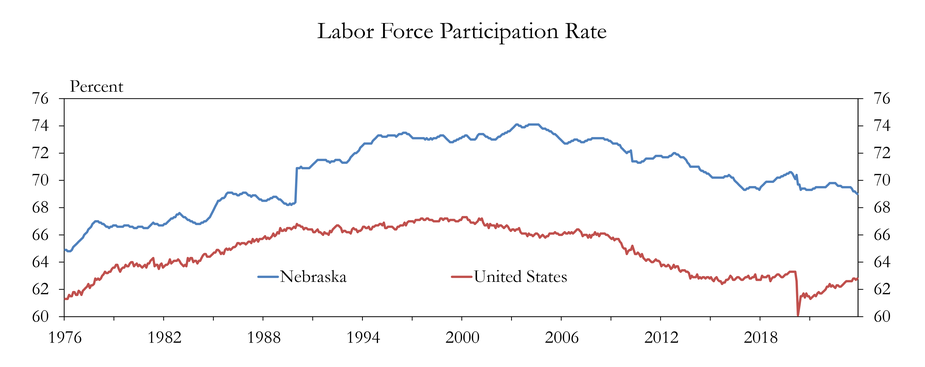
Sources: BLS, Haver Analytics.
Labor force participation has trended down for men and, despite a recent uptick, younger individuals.
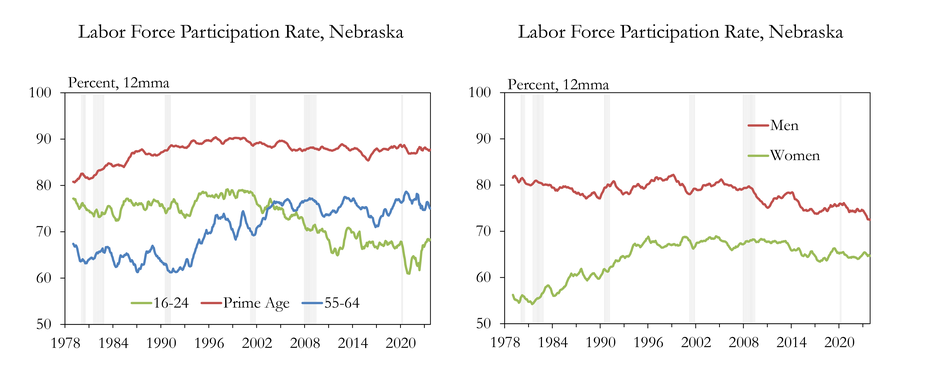
Sources: BLS, Haver Analytics.
Note: Gray bars indicate NBER-defined recessions.
Compared with the historical average, participation among young individuals has fallen consistently.
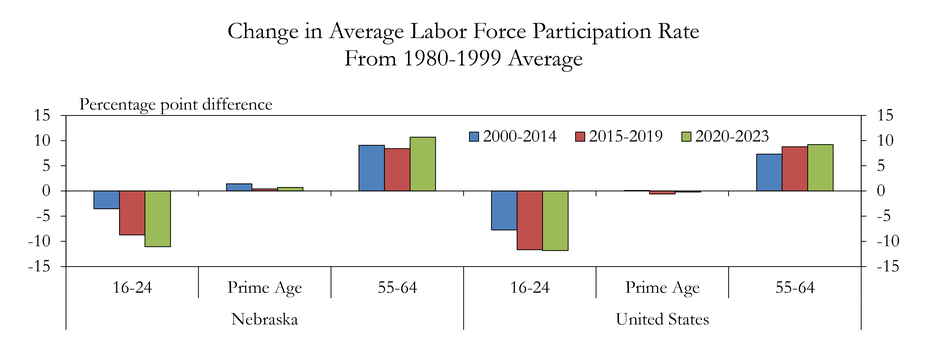
Sources: BLS, staff calculations.
By 2023, those young workers who did hold jobs were also working fewer hours than previous years.
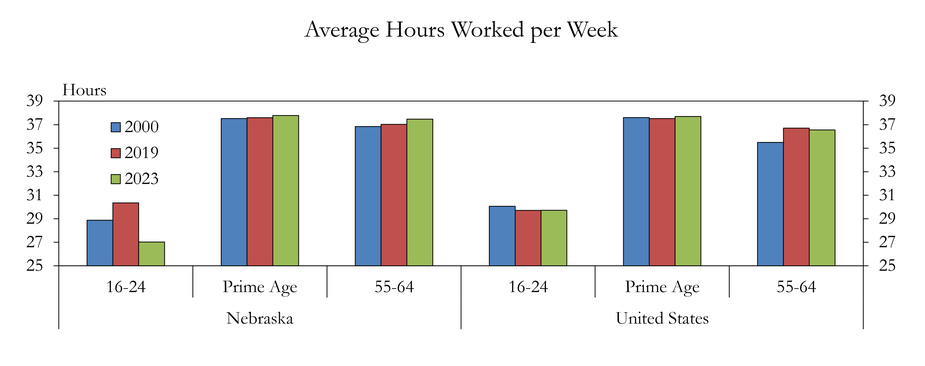
Sources: BLS, staff calculations.
Participation for younger men has fallen steadily since the turn of the century.
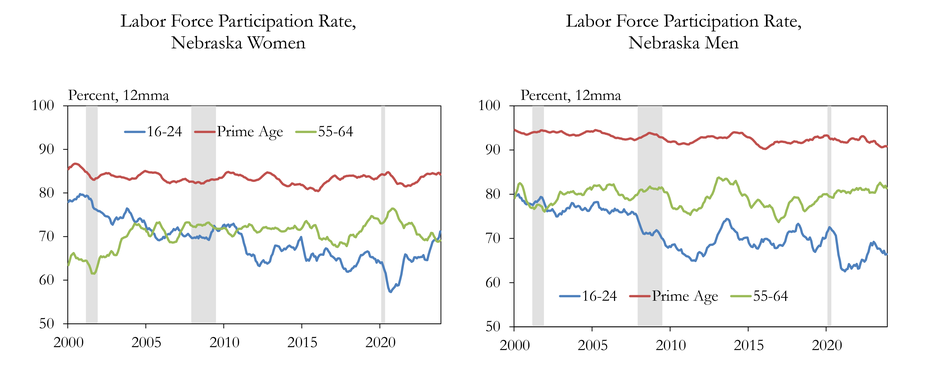
Sources: BLS, staff calculations.
Note: Gray bars indicate NBER-defined recessions.
For both men and women, declines in participation among workers younger than 22 had been most notable.
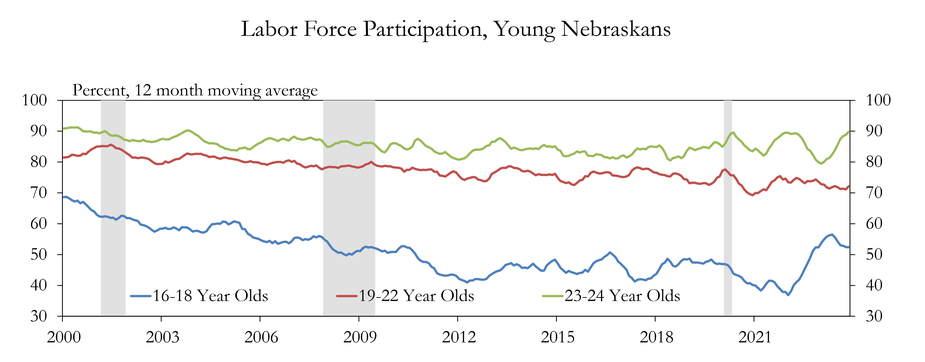
Sources: BLS, staff calculations.
Note: Gray bars denote NBER-defined recessions.
However, recent robust wage gains for young workers may have contributed to an uptick in participation.
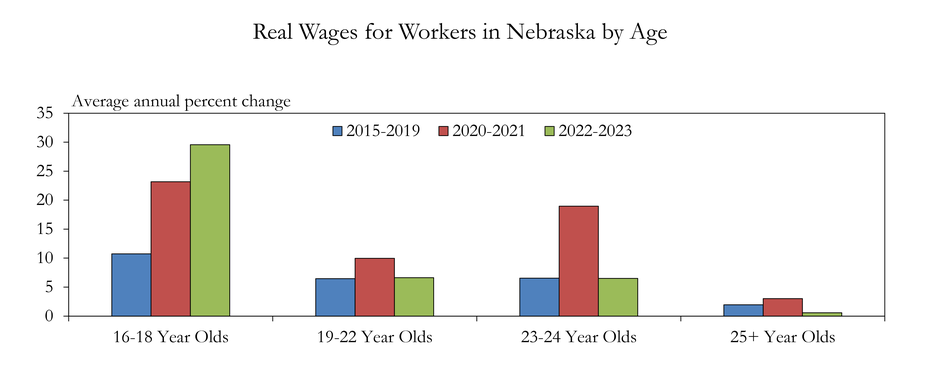
Sources: BLS, staff calculations.
Nebraska’s labor force in 2023 would have been larger if younger individuals participated at the same rate as in the past.
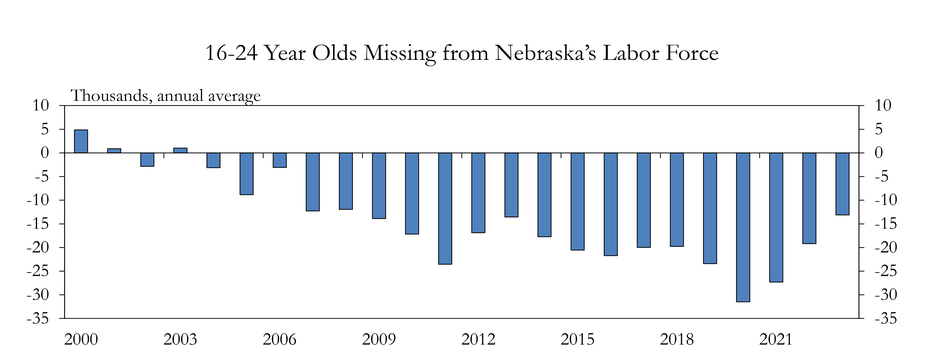
Sources: BLS, staff calculations.
Note: Missing labor force participants are calculated by subtracting the observed labor force from a hypothetical labor force based on the average labor force participation rate from 1980 to 1999.
Labor scarcity may have become slightly less pronounced if younger workers had continued to be as actively employed as in the past.
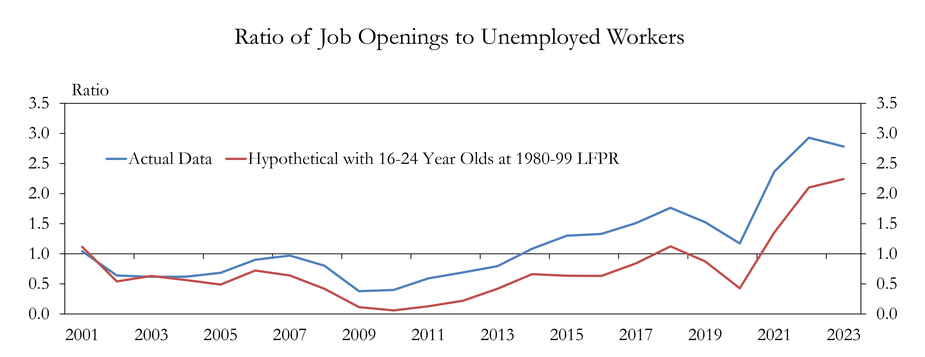
Sources: BLS, Census Bureau – ACS 1-year PUMS estimates, IPUMS.org, staff calculations.
Note: The hypothetical job openings-to unemployed ratio is calculated by applying the average LFPR of 16-24 year olds between 1980 and 1999 to the data from 2000 to 2023. Individuals added to the labor force from 2000 to 2023 based on historical rates of participation are assumed to be unemployed at their average rate of each year, and the remainder are assumed to fill job openings.
Growing the labor force among younger individuals could reduce job openings in leisure and hospitality.
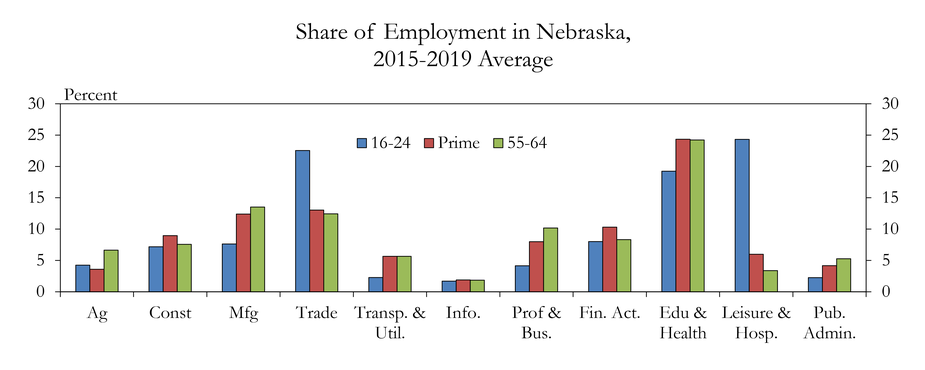
Sources: BLS, staff calculations.
Key Takeaways
The youth labor force has been declining for decades, with fewer individuals actively seeking employment. In the current environment, many of the businesses struggling to hire are those that disproportionately employ younger workers. While not a solution for all labor scarcity issues, increasing participation among the youngest members of the labor force could help fill some job openings in industries struggling most with shortages. It appears that young workers are responsive to wage signals, having returned to the labor force alongside recent robust wage growth, offering one potential path forward for businesses struggling to find labor.
The views expressed are those of the authors and do not necessarily reflect the positions of the Federal Reserve Bank of Kansas City or the Federal Reserve System.